
Figure 4.
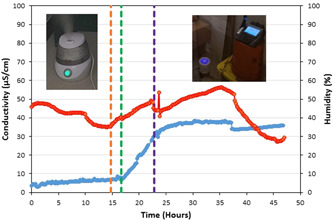
Plot of conductivity (blue line) and humidity (red line) inside the test room. The orange, green, and purple vertical dashed lines show the time the humidifier was turned on, the time sodium chloride was added to the water inside the humidifier, and the time the humidifier was turned off, respectively. Images showing this arrangement in the room can also be seen in this figure [Color figure can be viewed at wileyonlinelibrary.com]