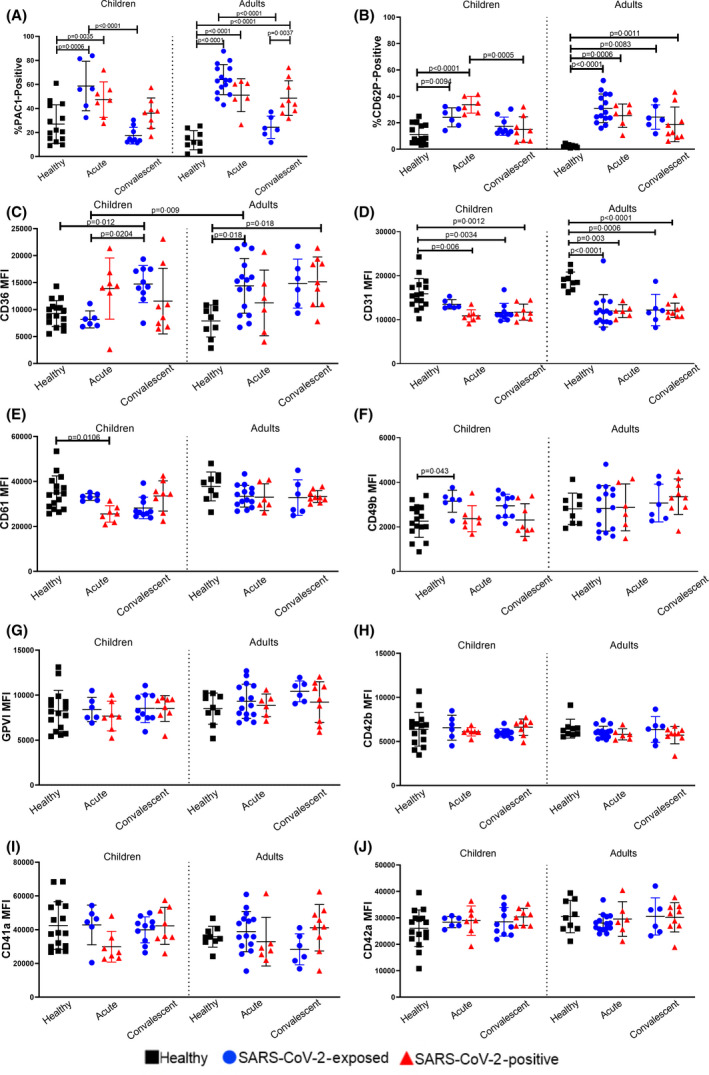
Fig 1.

Flow Cytometry Results summary of platelet markers. Values are expressed as mean ± standard deviation. A) Percentage of platelets positive for PAC1. B) Percentage of platelets positive for CD62P. C) CD36 MFI. D) CD31 MFI. E) CD61 MFI. F) CD49b MFI. G) GPVI MFI. H) CD42b MFI. I) CD41a MFI. J) CD42a MFI. Statistically significant results are indicated by a connecting line and P‐value. Within each graph, results from child platelets are reported on the left and results from adults are reported on the right. Black squares denote healthy controls, blue circles denote SARS‐CoV‐2‐exposed individuals and red triangles denote SARSCoV‐2‐positive individuals. Activation markers (A–B) are presented as percentage positive, all other platelet surface markers (C–J) are presented as Median Fluorescence Intensity (MFI). Differences within age groups were determined using ANOVA with Tukey’s multiple comparison test, while differences between age groups were determined using a t‐test with Bonferroni correction. [Colour figure can be viewed at wileyonlinelibrary.com]
