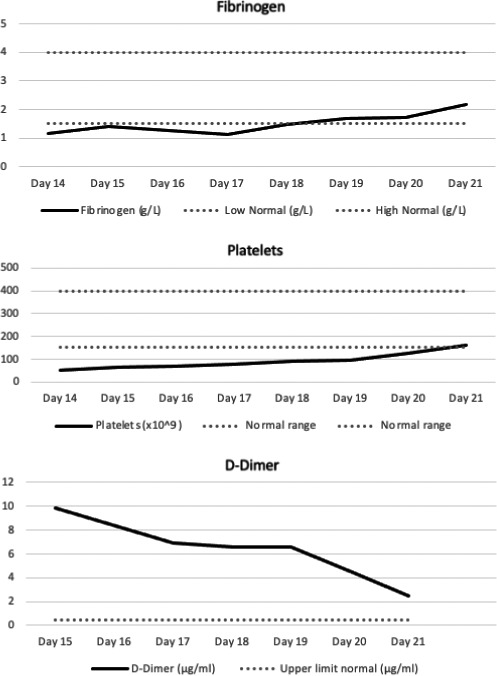
Fig 1.

Fibrinogen trend versus number of days post‐vaccination; platelet trend versus number of days post‐vaccination; D‐dimer trend versus number of days post‐vaccination. Bold continuous line: patient results. Area between dotted grey lines: normal range.
