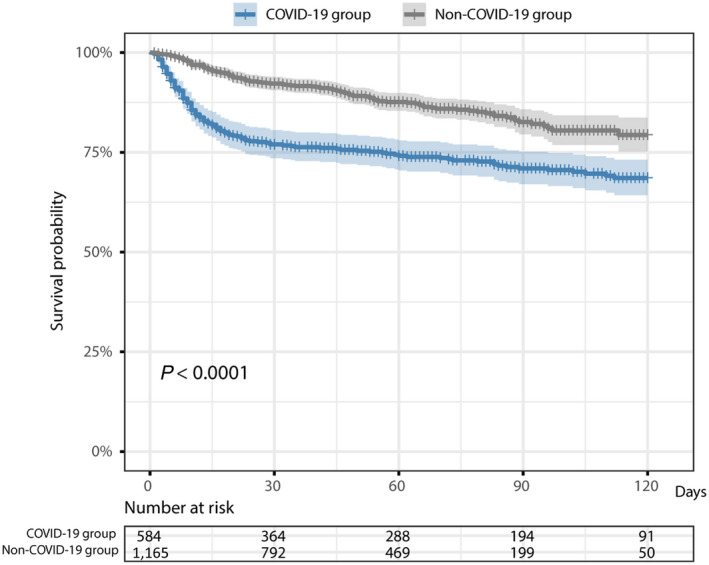
FIG. 1.

K‐M curves for the comparison of time to death in the group with COVID‐19 vs. the group without COVID‐19 following the SARS‐CoV‐2 RT‐PCR test. The death date for 1 patient in the group with COVID‐19 was missing. The P value is based on the log‐rank test.
