FIGURE 1.

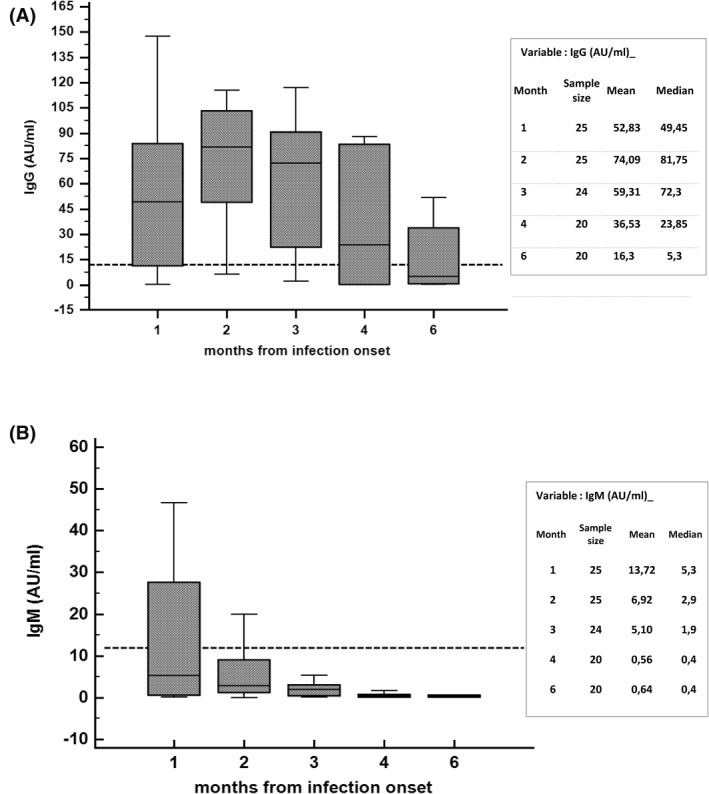
Determination of IgG (A) and IgM (1B) antibody levels against SARS‐CoV‐2 at different time points from SARS‐CoV‐2 infection onset. Horizontal dot line represents positive cut‐off value (12 UA/ml)

Determination of IgG (A) and IgM (1B) antibody levels against SARS‐CoV‐2 at different time points from SARS‐CoV‐2 infection onset. Horizontal dot line represents positive cut‐off value (12 UA/ml)