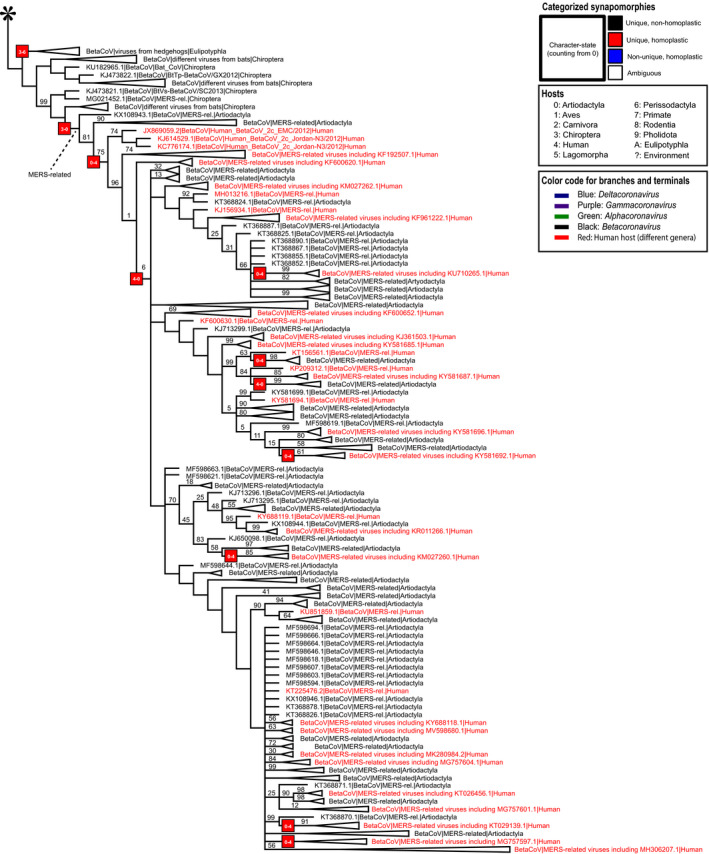
Fig. 3.

Strict consensus from parsimony analyses (part 2 of 3). The asterisk on the top indicates the continuity with Fig. 2. See Appendix S1h for a complete version of this tree with branch lengths. The figure focuses on MERS‐related clades. Clade frequencies calculated using the bootstrap strategy are at the top of each branch except if equal to 100. Some clades are collapsed to improve visualization. [Colour figure can be viewed at wileyonlinelibrary.com]
