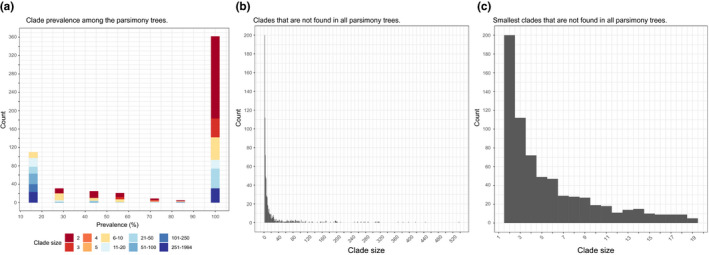
Fig. 5.

Histograms comparing the clades in the ML tree with the clades in all of the six best heuristic results from the parsimony analysis: (a) prevalence of clades from the ML tree among parsimony analysis; (b) all the clades that are not present in all parsimony trees; and (c) clades smaller than 20 terminals that are not present in all parsimony trees. [Colour figure can be viewed at wileyonlinelibrary.com]
