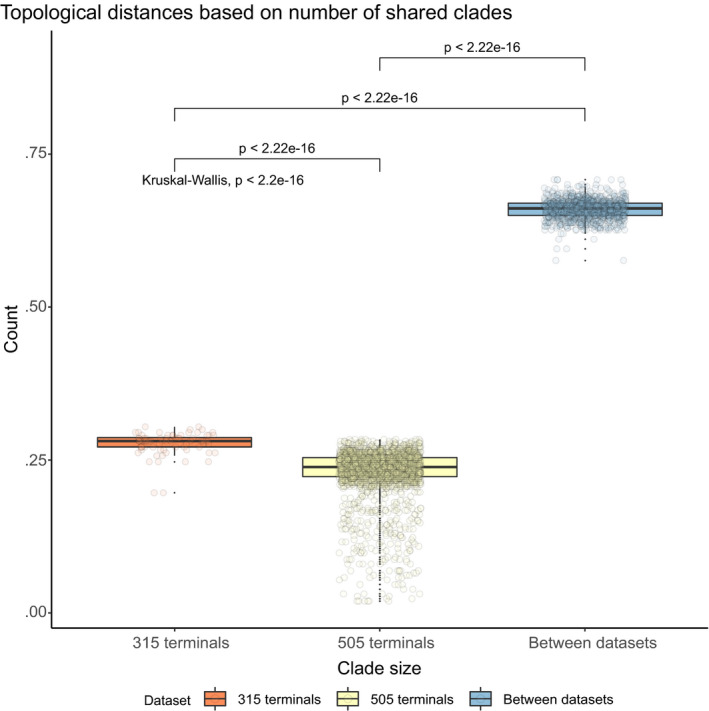
Fig. 6.

Data plot illustrating how the most parsimonious trees differ among datasets using the percentage of shared branches among trees. This is calculated using local distances (LD) calculated as one minus the ratio between the number of shared branches between trees (S) and the different branches in both trees (U): . Orange, distance among best heuristic results for the 315 terminals dataset; yellow: distance among best heuristic results for the 505 terminals dataset; blue: distance between trees from each dataset. [Colour figure can be viewed at wileyonlinelibrary.com]
