
FIGURE 1.
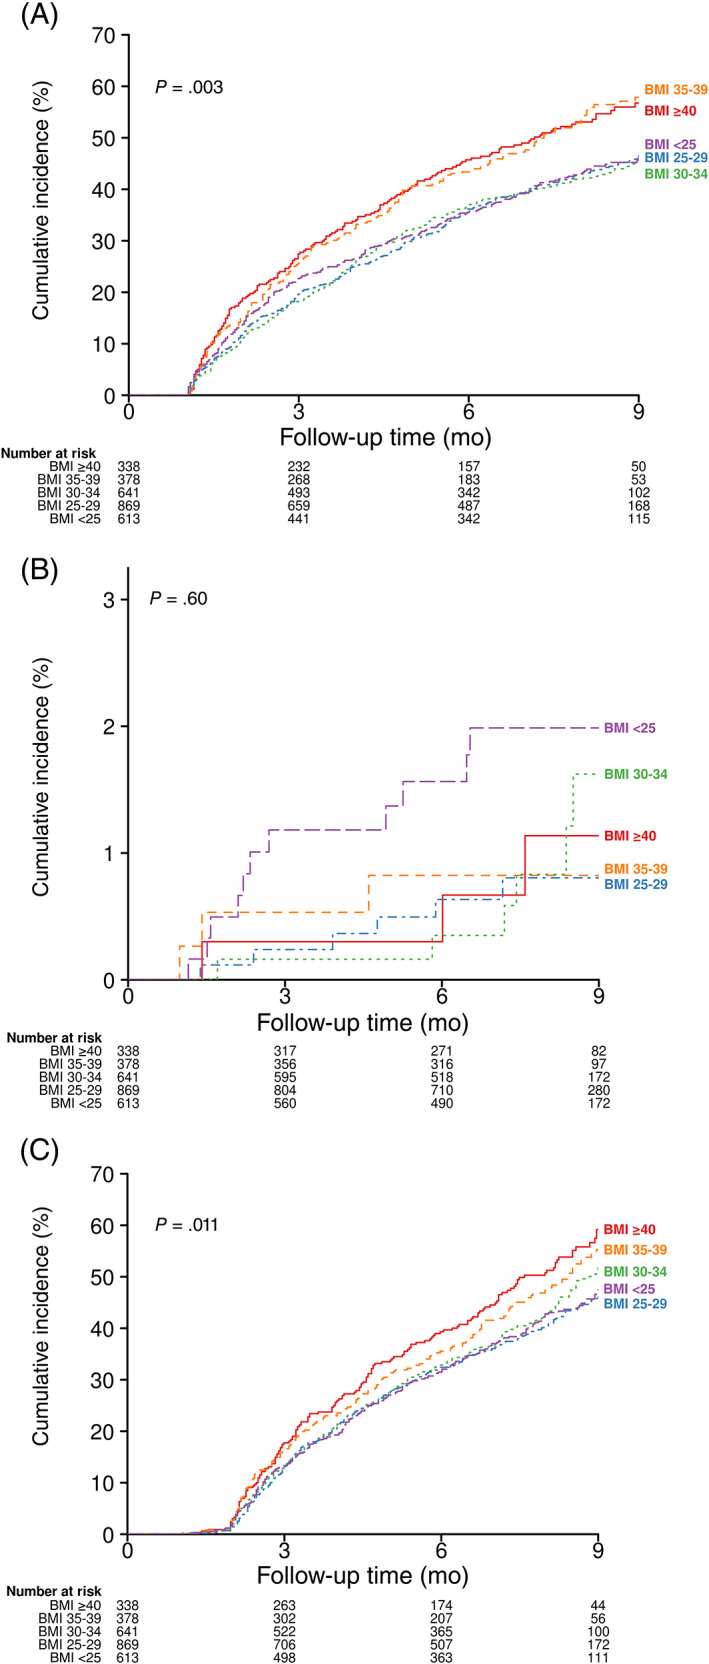
Kaplan‐Meier curves of COVID‐19 survivors over time to A, hospital admission, B, mortality, and C, the ordering of any diagnostic test in five body mass index (BMI, kg/m2) groups. P values are from the stratified log‐rank tests for comparison of Kaplan‐Meier curves