
FIGURE 2.
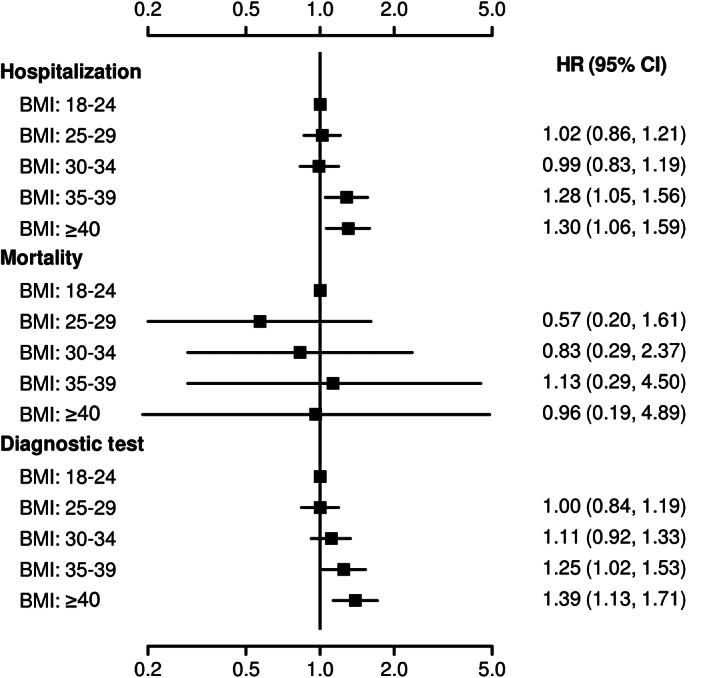
Outcomes stratified by five body mass index (BMI) groups: forest plot displaying adjusted hazard ratio (HR) and 95% confidence interval (CI) for each of the BMI subgroups compared with BMI 18 to 24.9 kg/m2 as a reference
Official websites use .gov
A
.gov website belongs to an official
government organization in the United States.
Secure .gov websites use HTTPS
A lock (
) or https:// means you've safely
connected to the .gov website. Share sensitive
information only on official, secure websites.
Outcomes stratified by five body mass index (BMI) groups: forest plot displaying adjusted hazard ratio (HR) and 95% confidence interval (CI) for each of the BMI subgroups compared with BMI 18 to 24.9 kg/m2 as a reference