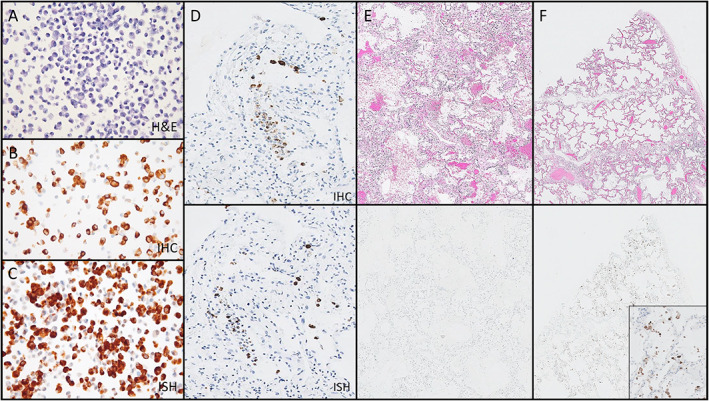
Figure 2.

Assessment of IHC and ISH for the identification of SARS‐CoV‐2‐infected cells. (A–C) Positive control cell block made of SARS‐CoV‐2‐infected VERO cells, with hematoxylin and eosin (A, ×200 magnification), IHC using the Thermo‐Fisher Scientific monoclonal antibody (B, ×200 magnification), and RNAScope ISH (C, ×200 magnification). (D) Paired region analysis showing the distribution of virus‐infected cells is comparable between IHC (upper panel) and ISH (lower panel) (×100 magnification). (E) Paired region analysis showing that histopathologic changes associated with COVID‐19 (upper panel) may be negative for virus‐infected cells by IHC (lower panels) (×20 magnification). (F) Paired region analysis showing relatively bland areas (upper panel) may have many virus‐infected cells by IHC (lower panel) (F, ×20 magnification; inset ×200 magnification). All magnifications represent total magnification.
