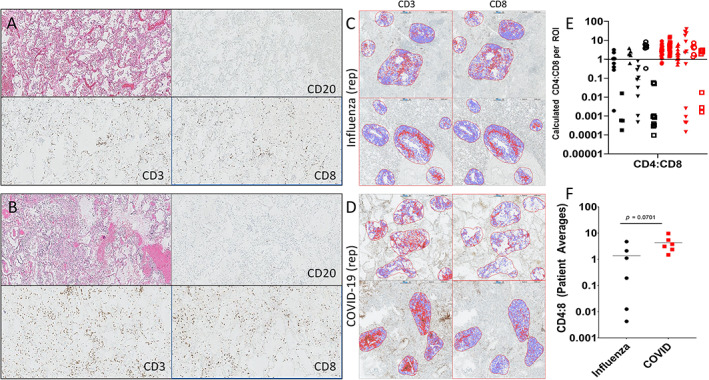
Figure 6.

Quantitative assessment of inflammation in COVID‐19 and seasonal influenza. Representative paired regions showing hematoxylin and eosin (H&E) staining along with CD20, CD8, and CD3 immunostains (clockwise from H&E) for (A) influenza and (B) COVID‐19. The distribution of T‐cells and relative abundance of CD8‐positive cells relative to CD3 is comparable. (C,D) Representative ROI analysis for CD3 and CD8 immunostains in a case of (C) fatal influenza and (D) COVID‐19. (E,F) Graphical representation of individual CD4:CD8 ratios per ROI (E) and cumulative CD4:CD8 ratios per patient (F). Note that there is no significant difference of CD4:CD8 ratios between COVID‐19 and influenza, although there is a trend toward higher CD4:CD8 for COVID‐19. In Figure 1E, individual patients are identified by a unique shape on the graph for each disease.
