
Fig. 6.
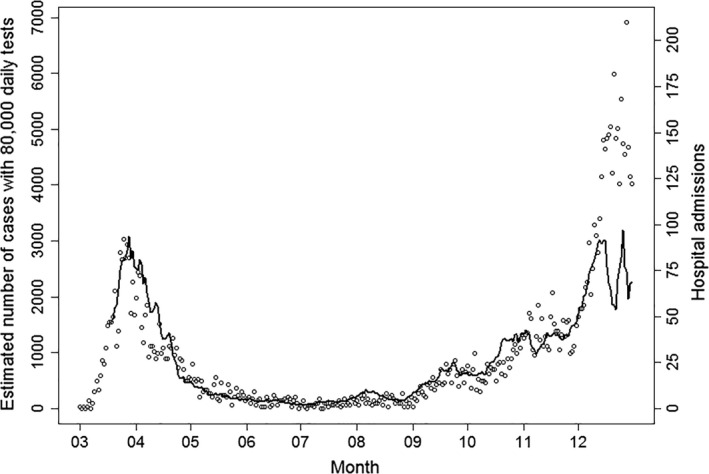
Estimated number of new cases using a correction factor for test activity (solíd black line), which empirically corrects for time‐varying testing behavior, test capacity, and targeted testing efforts. For ease of interpretation, the calculation is made relative to a fixed reference number of 80.000 daily tests. Points show the daily number of hospital admissions of cases with COVID‐19 for comparison. The estimated number of new cases follows hospital admission closely up to the middle of December, but the model fit was impacted by the substantial variation in testing activity in the last half of December due to seasonal changes in testing behavior around Christmas and the New Year.