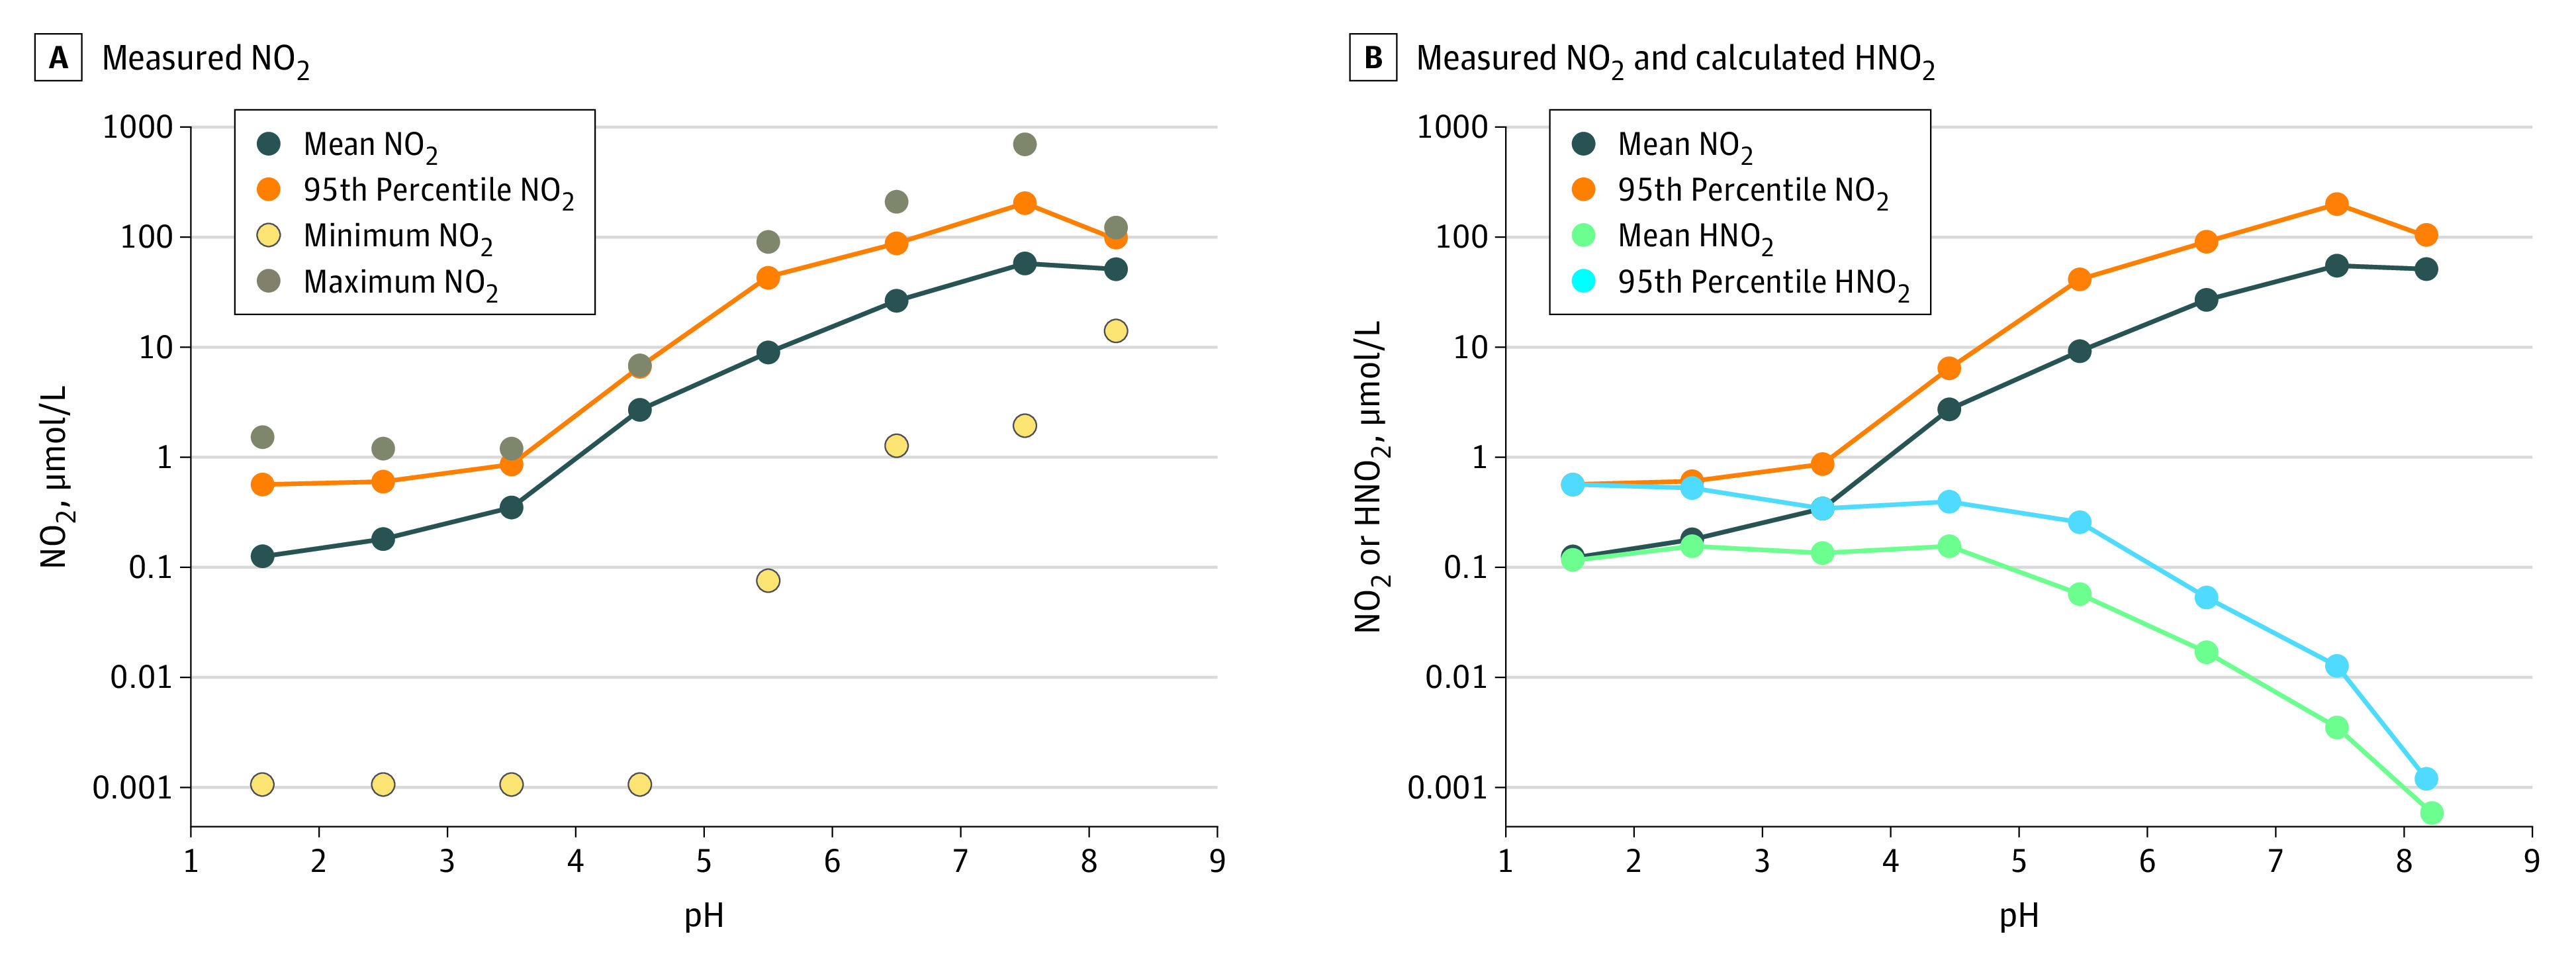
Figure 1. pH Dependence of Nitrite (NO2) Concentration From the Clinical Data in the Study by Xu and Reed11.

Plots of the nitrite concentration in gastric fluid from Xu and Reed11 from 457 patients undergoing upper endoscopy for various gastrointestinal conditions. The patients included those with chronic superficial gastritis, chronic atrophic gastritis, gastric ulcer, gastric carcinoma, pernicious anemia, esophagitis, duodenal ulcer, and normal gastric histology and those who had undergone vagotomy or partial gastrectomy. Points are displayed at the midpoint of the pH range for each group. The actual pH ranges of each group are 1.13 to 1.99, 2.00 to 2.99, 3.00 to 3.99, 4.00 to 4.99, 5.00 to 5.99, 6.00 to 6.99, 7.00 to 7.99, and 8.00 to 8.42. See eTable 1 in the Supplement for additional details.
