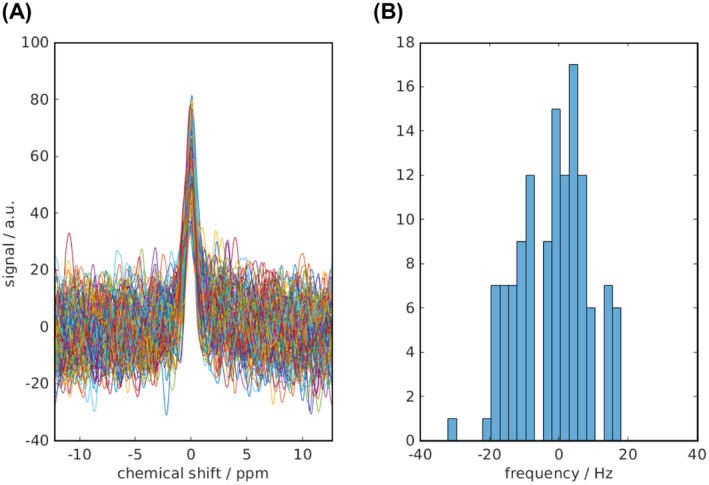
FIGURE 4.

With separate excitations for PCr and Pi, frequency fluctuations had the potential to affect pH estimation. In 1 data set (128 averages), the individual un‐averaged FIDs were extracted from the raw data and are plotted after apodization with the fitted line width (A); fluctuations are seen to average toward 0 mean frequency offset. The frequency distribution also lies within the fitted line width (65 Hz) (B)
