
FIGURE 6.
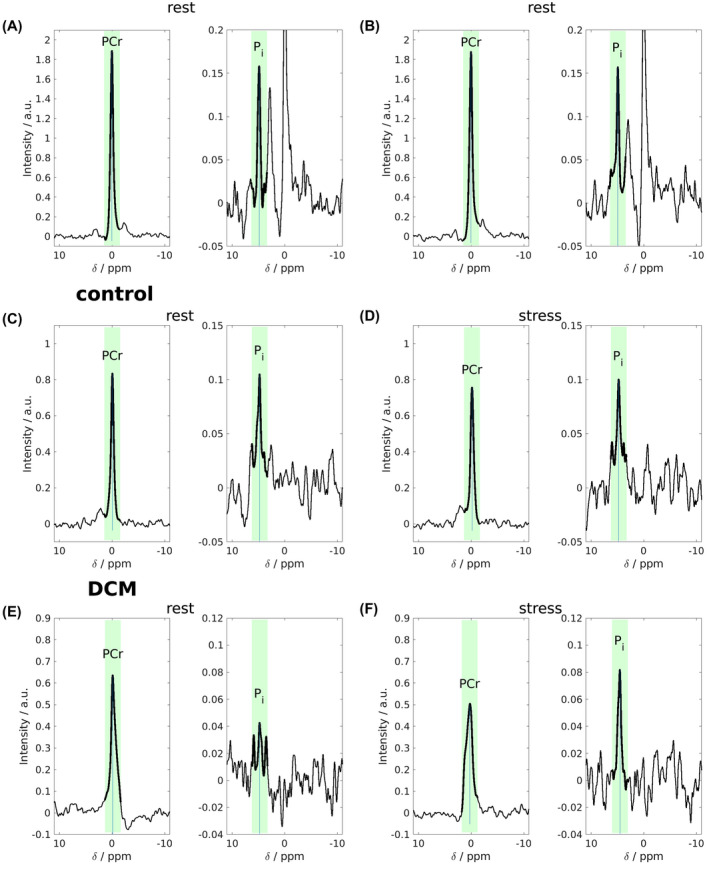
STEAM‐31P‐MRS spectra from the 2 interleaved acquisitions from different experiments. Repeatability scan data are shown (A,B) for a healthy volunteer. Rest (C,E) and dobutamine stress (D,F) data of another healthy volunteer (C,D) and the patient with DCM (E,F) are shown. In each interleave, the spectral region to be trusted is that immediately surrounding the metabolite excited marked by bolder lines and green background. Other parts of the spectrum arise from different spatial locations due to strong chemical shift displacement effects and cannot be taken as cardiac. Pi can clearly be resolved with little or no contaminating 2,3‐DPG. pH calculations are undertaken from the chemical shift of the Pi peak (taken from the Pi interleaf) relative to that of the PCr peak (taken from the PCr interleaf). DCM, dilated cardiomyopathy