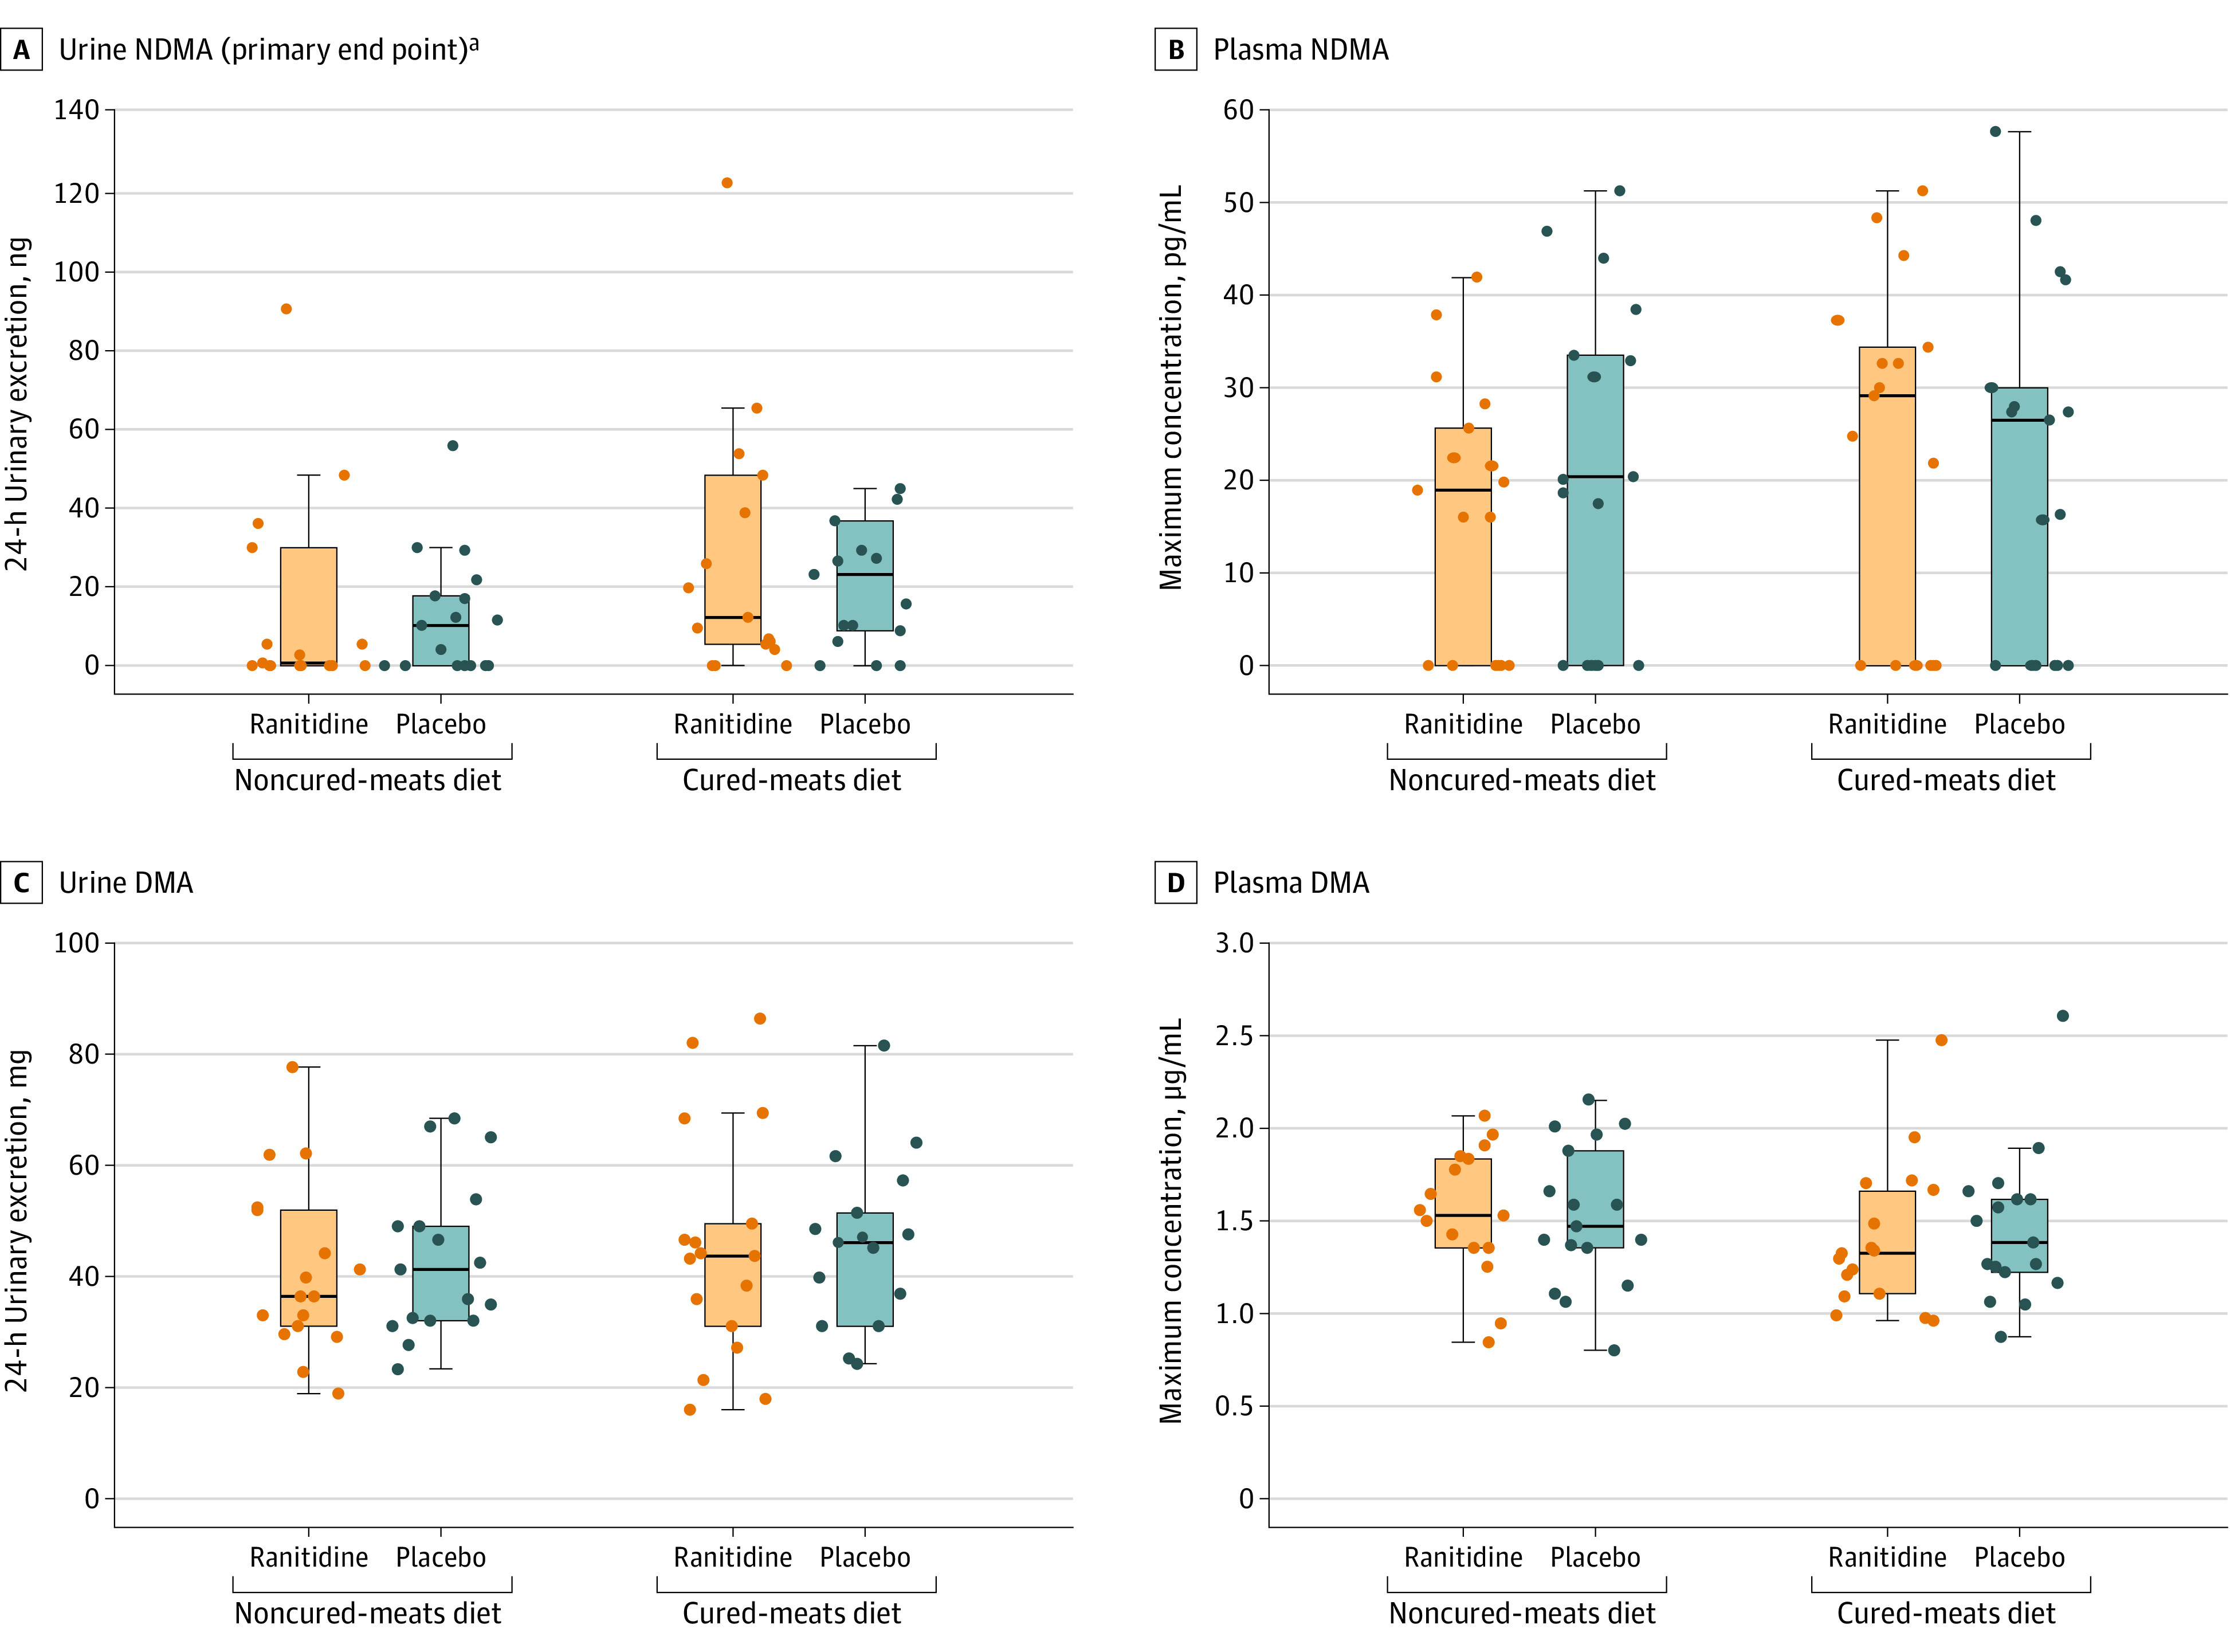
Figure 2. Twenty-Four–Hour Urinary Excretion and Maximum Plasma Concentration of NDMA and DMA by Treatment.

Individual participant (n = 17) observed data and box-and-whisker plot summaries. The line through each box represents the median. The lower and upper borders of the box represent the 25th and 75th percentile, respectively. The whisker extends from the box border to the last observation within 1.5 times the interquartile range. Twenty-four–hour urinary excretion and maximum plasma concentration of ranitidine by treatment are shown in eFigure 7 in Supplement 2. DMA indicates dimethylamine; NDMA, N-nitrosodimethylamine.
aTwo participants had 24-hour urinary excretion of NDMA in 1 or more periods that are outside the scale of the graph in panel A. Participant 12 had a cumulative NDMA excretion of 512 ng with the ranitidine/noncured-meats diet, 649 ng with the ranitidine/cured-meats diet, and 746 ng with the placebo/cured-meats diet (see post hoc assessments section of the Results and eTable 6 in Supplement 2 for additional information on this participant). Participant 03 had a cumulative NDMA excretion of 271 ng with the placebo/cured-meats diet.
