. 2021 May 3;18(3 Suppl):471–486. doi: 10.21873/cgp.20273

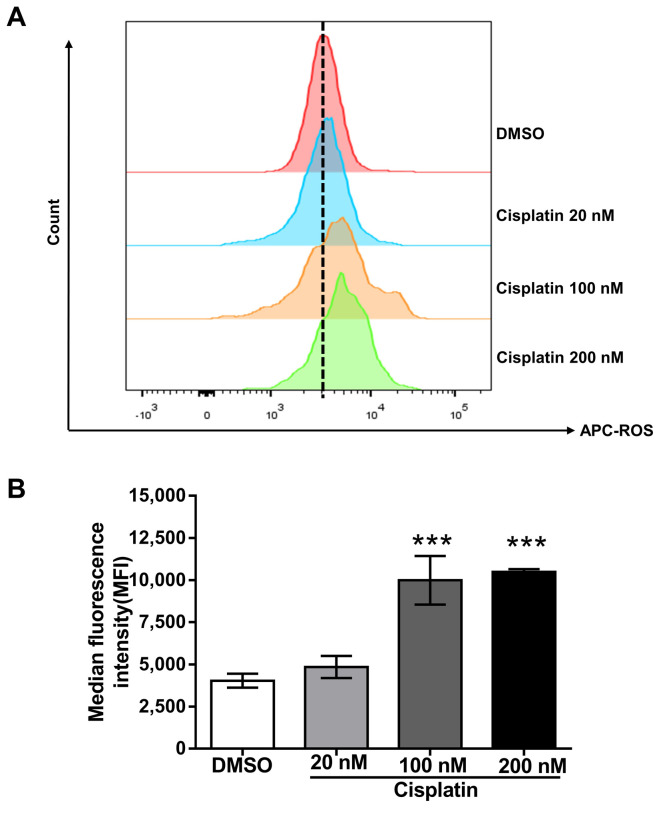
Figure 2. The impact of cisplatin on ROS generation. (A) PC9 cells incubated with cisplatin at different concentrations (or DMSO as control) for 72 h were stained with ROS deep red dye. The fluorescent signal was measured by flow cytometry, and the median fluorescence intensity (MFI) was determined. The histogram shows that the ROS levels increased in a concentration-dependent manner. (B) The bar diagram shows that the ROS production increased in a dose-dependent manner. Data (mean±SD) are representative of three technical replicates. Data were analyzed by one-way ANOVA with Bonferroni’s multiple comparison test. ***p<0.001 compared with the DMSO-treated group.

Figure 2