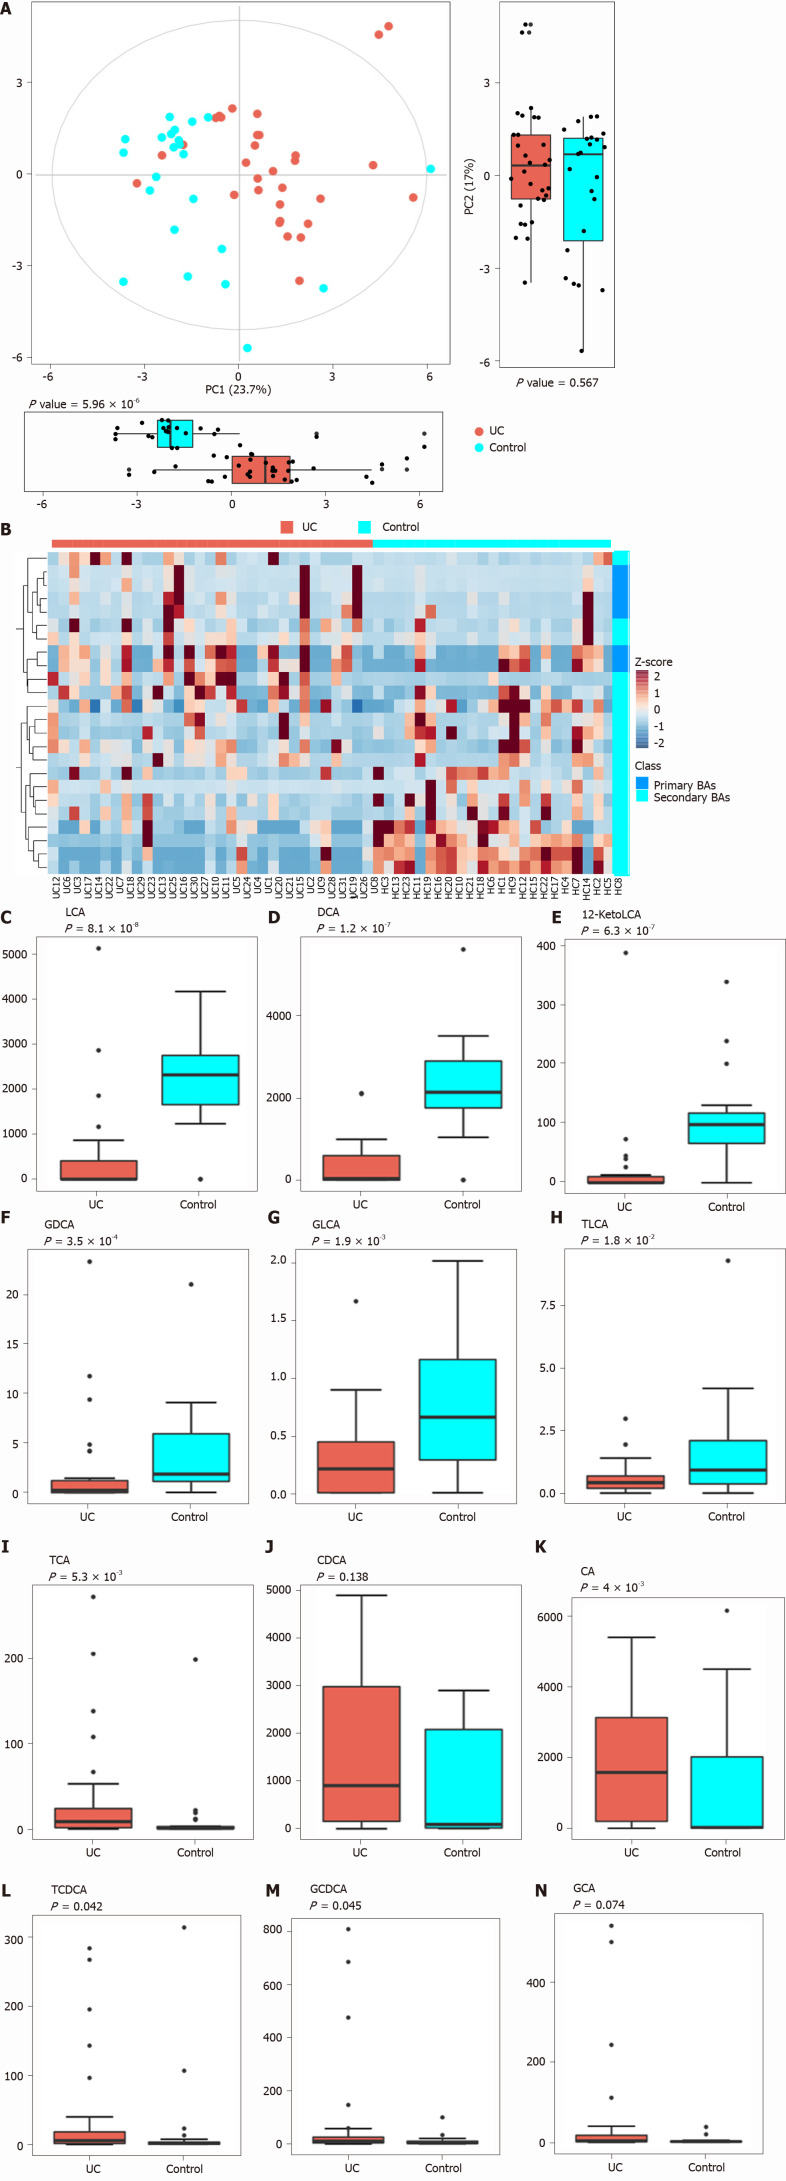
Figure 3.
Analysis of difference in fecal bile acids between the ulcerative colitis and control groups. A: Principal component analysis was performed to evaluate the similarity of the fecal BAs of the two groups. Twenty-four BAs clearly distinguished the ulcerative colitis (UC) group from the control group; B: Heatmap showing the individual BA concentrations in the samples (log-transformed). Shades of red and blue represent high and low BA concentrations, respectively (see color scale); C-H: Fecal secondary BAs in UC patients, such as lithocholic acid, deoxycholic acid, glyco-deoxycholic acid, glyco-lithocholic acid, and tauro-lithocholate, were significantly lower than those in healthy controls; I and K-M: The primary BAs such as tauro-cholic acid, cholic acid, tauro-chenodeoxycholic acid, and glyco-chenodeoxycholic acid were significantly higher than those in healthy controls; J and N: The concentrations of chenodeoxycholic acid and glyco-cholic acid showed a tendency to increase in UC patients but the increases were not significant. UC: Ulcerative colitis; PCA: Principal component analysis; BAs: Bile acids; LCA: Lithocholic acid; DCA: Deoxycholic acid; GDCA: Glyco-deoxycholic acid; GLCA: Glyco-lithocholic acid; TLCA: Tauro-lithocholate; TCA: Tauro-cholic acid; CA: Cholic acid; TCDCA: Tauro-chenodeoxycholic acid; GCDCA: Glyco-chenodeoxycholic acid; CDCA: Chenodeoxycholic acid; GCA: Glyco-cholic acid.

