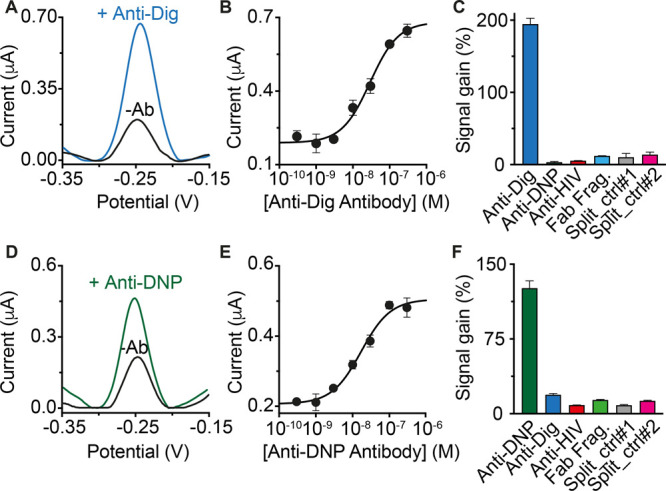
Figure 3.

(A) SWV voltammograms obtained in the absence (black) and presence (blue) of anti-Dig antibodies using the optimized anti-Dig-responsive DNA circuit. (B) Current peak values obtained at increasing concentrations of anti-Dig antibodies. (C) Signal gain values observed at saturating concentration (300 nM) of anti-Dig antibodies, with non-specific antibodies and with different control experiments. Signal gain values are calculated as the relative signal change compared to the blank (−Ab) current signal. (D) SWV voltammograms, (E) dose–response curve, and (F) specificity tests obtained using a DNA-based circuit responsive to anti-DNP antibodies. The experiments were performed in a 100 μL solution containing 90% bovine serum and 10% buffer solution (500 mM Na2HPO4 and 1.5 M NaCl at pH 7.0). The solution also contains the pre-hybridized DNA duplex (60 nM), Dig/DNP-conjugated DNA strands (100 nM each), and anti-Dig/anti-DNP antibodies (300 nM). The antibody-responsive circuits were allowed to react for 30 min at RT and then transferred to the disposable electrode surface. SWV scans were performed between −0.35 and −0.15 V at 50 Hz after 120 min from the transfer of the solution on the electrode.
