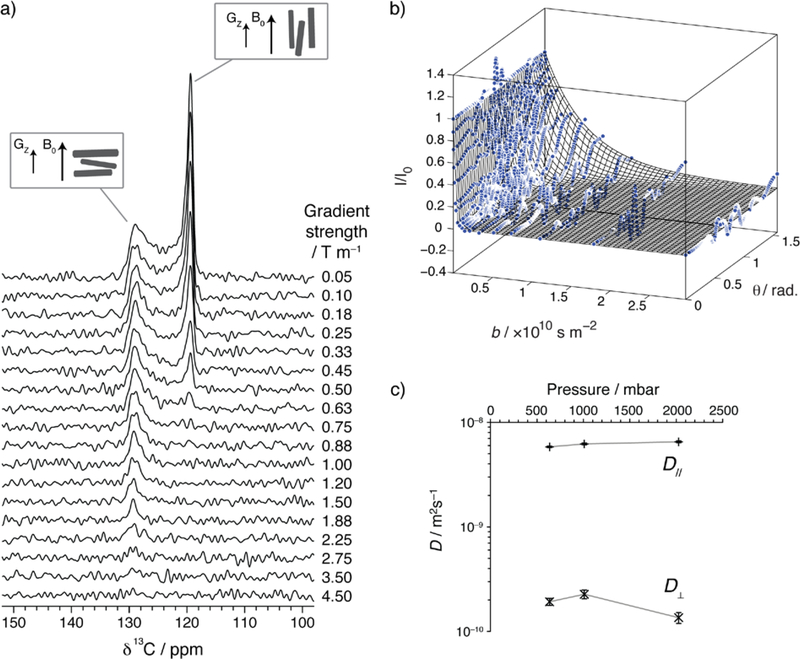
Figure 4.
(a) PFG NMR (7.1 T) spectra for Zn2(dobpdc) crystals (sample 1) at a pressure of 625 mbar 13CO2 with different applied gradient strengths (T = 25 °C). (b) Data and fit for results shown in (a) with PFG NMR signal decays shown as a function of crystal orientation, θ. The fit is represented as a meshed surface. Data points are shown as blue circles and are normalized to 1 for g = 0.05 T m−1 for all crystal orientations (note that this normalization results in more noisy data at intermediate θ values where absolute signal intensities are weaker, due to the small number of crystals at these orientations). (c) Self-diffusion coefficients obtained at 25 °C for Zn2(dobpdc) crystals (Sample 1) dosed with different pressures of 13CO2. The errors in these values arise from uncertainty in the fitting procedure, and represent 95% confidence limits.

