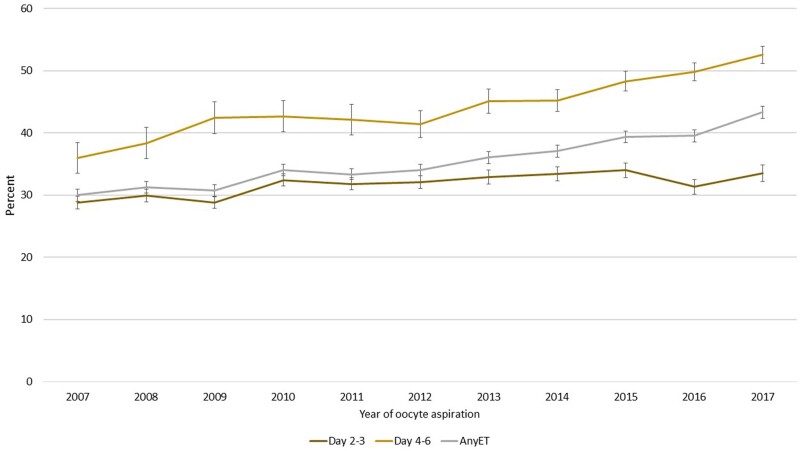
Figure 3.
CLBR per oocyte aspiration, where oocyte aspirations not amounting to any embryo transfer are excluded. Categorized by day of transfer, Days 2 and 3 (cleavage stage), Days 4–6 (blastocyst stage) and both groups altogether (any embryo transfer: ET). All three graphs show CLBR. The number of culture days in the graph represents the latest performed ET, either leading to live birth or being the latest ET within 1 year after one oocyte aspiration. CLBR, cumulative live birth rate. ET, embryo transfer.

