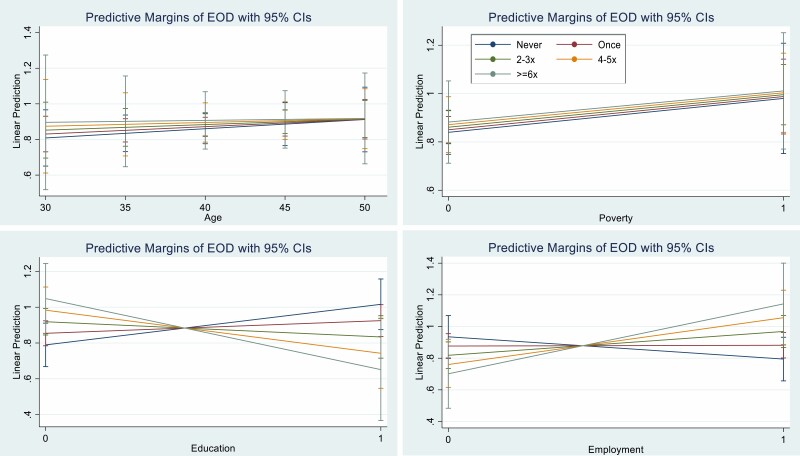
Fig. 2.
Interaction plots of the adjusted estimates for relative telomere length for institutional racial discrimination (EOD) and age, educational attainment, employment status, and poverty among African American Women’s Heart & Health study participants (N = 134). The 5-level ordinal EOD categories represent increasing lifetime exposure to institutional racial discrimination; never (<9), once (9–16), 2–3 times (17–24), 4–5 times (25–32), and 6 or more times (33–40). Nonparallel lines provide evidence of statistical interaction.

