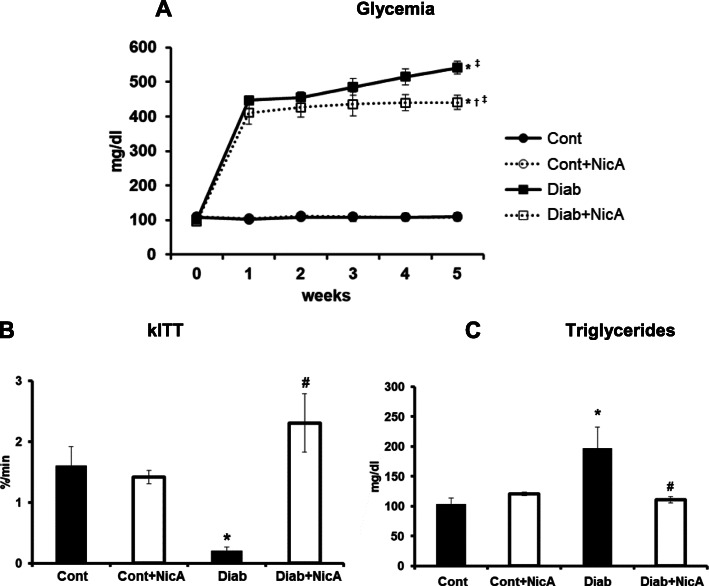
Fig. 2.
2A, Fasting glycemia of control (Cont, n = 8); control nicotinamide (Cont+NicA, n = 7); diabetes (Diab, n = 7) and diabetes nicotinamide (Diab+NicA, n = 8) groups; *p ≤ 0.0001 vs. Cont; †p ≤ 0.0001 vs. Cont+NicA; ‡p ≤ 0.0001 week 5 vs. week 0 in the same group. 2B, Insulin tolerance test evaluated by the constant decrease for plasma glucose (kITT) of control rats (Cont, n = 8) control nicotinamide (Cont+NicA, n = 7); diabetes (Diab, n = 7) and diabetes nicotinamide (Diab+NicA, n = 8); *p ≤ 0.0001 vs. Cont; #p ≤ 0.0001 vs. Diab. 2C, Fasting triglycerides levels of control rats (Cont, n = 8); control nicotinamide (Cont+NicA, n = 7); diabetes (Diab, n = 7) and diabetes nicotinamide (Diab+NicA, n = 8); *p ≤ 0.05 vs. Cont; #p ≤ 0.01 vs. Diab

