Fig. 4.
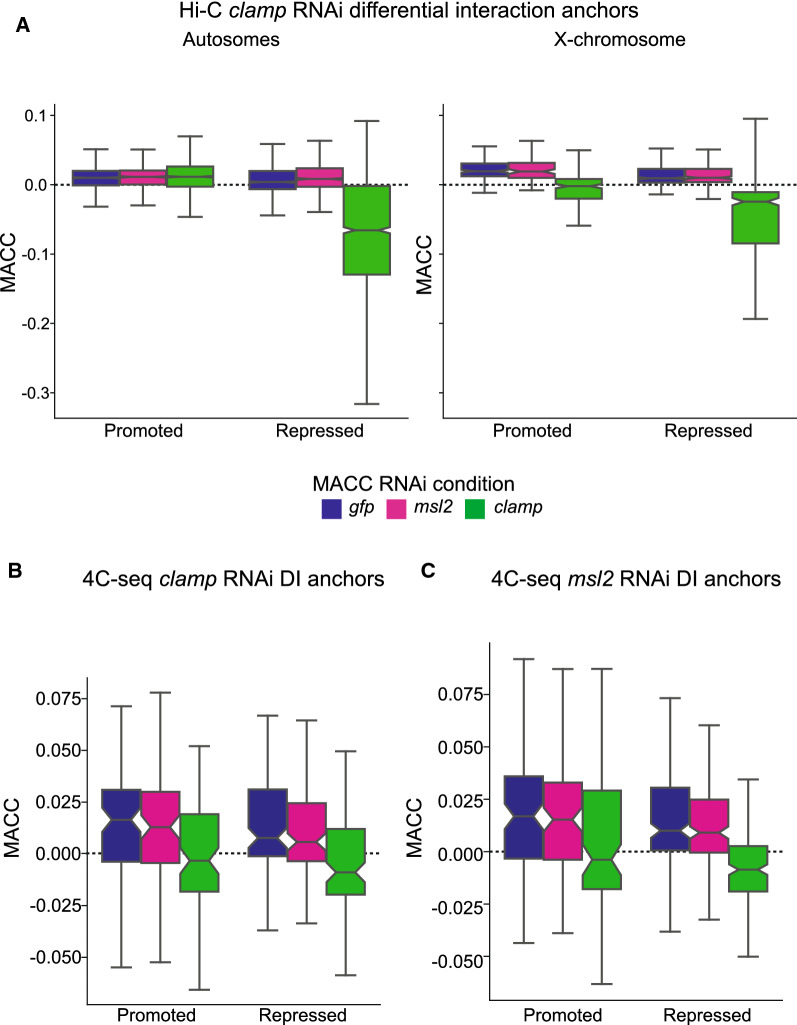
CLAMP regulation of the three-dimensional organization is linked to its role in altering chromatin accessibility. A Distribution of chromatin accessibility MACC values within CLAMP Hi-C DI anchors as measured when MACC was previously calculated under RNAi conditions of gfp (blue), msl2 (pink) and clamp (green). A positive MACC value indicates accessible chromatin, whereas a negative MACC value indicates inaccessible chromatin [25]. On the autosomes, CLAMP-promoted interactions occur in regions that are accessible under all three RNAi conditions. In contrast, autosomal CLAMP-repressed interactions occur in regions that have lowered chromatin accessibility after clamp RNAi (promoted interactions: gfp RNAi n = 2104, msl2 RNAi n = 1052, clamp RNAi n = 2104; repressed interactions: gfp RNAi n = 1968, msl2 RNAi n = 984, clamp RNAi n = 1968). On the X-chromosome both CLAMP-promoted and repressed interactions occur in regions which are accessible after gfp and msl2 RNAi but become inaccessible after clamp RNAi (promoted interactions: gfp RNAi n = 196, msl2 RNAi n = 98, clamp RNAi n = 196; repressed interactions: gfp RNAi n = 466, msl2 RNAi n = 233, clamp RNAi n = 466). B Distribution of MACC values within CLAMP 4C-seq DI anchors. CLAMP 4C-seq identified DIs occur in regions which have significantly lowered chromatin accessibility after clamp RNAi (green) compared to control gfp RNAi (blue) (promoted interactions: gfp RNAi n = 87, msl2 RNAi n = 87, clamp RNAi n = 87; repressed interactions: gfp RNAi n = 110, msl2 RNAi n = 110, clamp RNAi n = 110).. No significant changes are observed for these CLAMP 4C-seq identified DI regions are observed following msl2 RNAi (pink). C Distribution of MACC values within MSL2 4C-seq DI anchors. MSL2 4C-seq identified DIs occur in regions that do not have significant changes in chromatin accessibility after msl2 RNAi (pink) compared to control gfp RNAi (blue). However, chromatin accessibility is significantly decreased following clamp RNAi (green) (promoted interactions: gfp RNAi n = 101, msl2 RNAi n = 101, clamp RNAi n = 101; repressed interactions: gfp RNAi n = 181, msl2 RNAi n = 181, clamp RNAi n = 181). For all box and whisker plots, the 95% confidence interval is shown with a notch around the median line; whiskers represent 1.5 IQR, outliers have been omitted (source data provided as Additional file 1: Source Data file).

