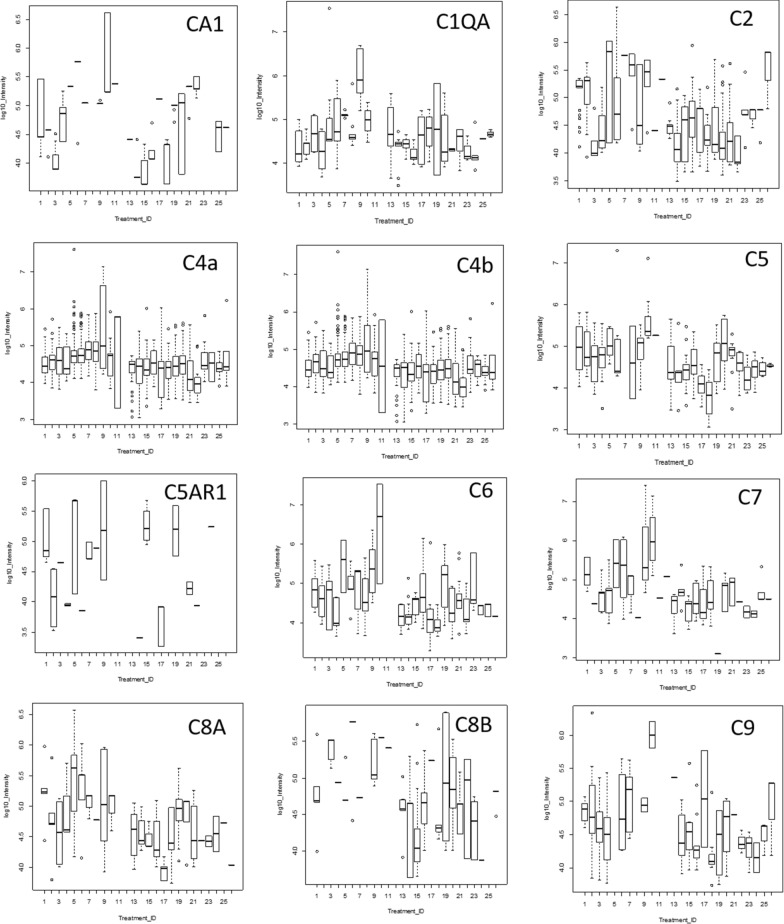
Fig. 4.
The distributions of log10 precursor intensity by quantile and box plots of complement proteins across the disease and control treatments. Treatment ID numbers: 1, Alzheimer normal; 2, Alzheimer’s normal control STYP; 3, Alzheimer’s dementia; 4, Alzheimer’s dementia STYP; 5, Cancer breast; 6, Cancer breast STYP; 7, Cancer control; 8, Cancer control STYP; 9, Cancer ovarian; 10, Cancer ovarian STYP; 11, Ice Cold; 12, Ice Cold STYP; 13, Heart attack Arterial; 14 Heart attack Arterial STYP; 15, Heart attack normal control, 16, Heart attack normal Control STYP; 17, Heart attack; 18, Heart attack STYP; 19, Multiple Sclerosis normal control; 20, Multiple sclerosis normal control STYP; 21, Multiple sclerosis; 22, Multiple Sclerosis STYP, 23 Sepsis; 24, Sepsis STYP; 25, Sepsis normal control; 26, Sepsis normal control STYP. There was significant effects of treatments and peptides by two-way ANOVA. Analysis of the proteins shown across treatments produced a significant F Statistic by one-way ANOVA. Note the C3 results were previously published [165]

