Fig. 1.
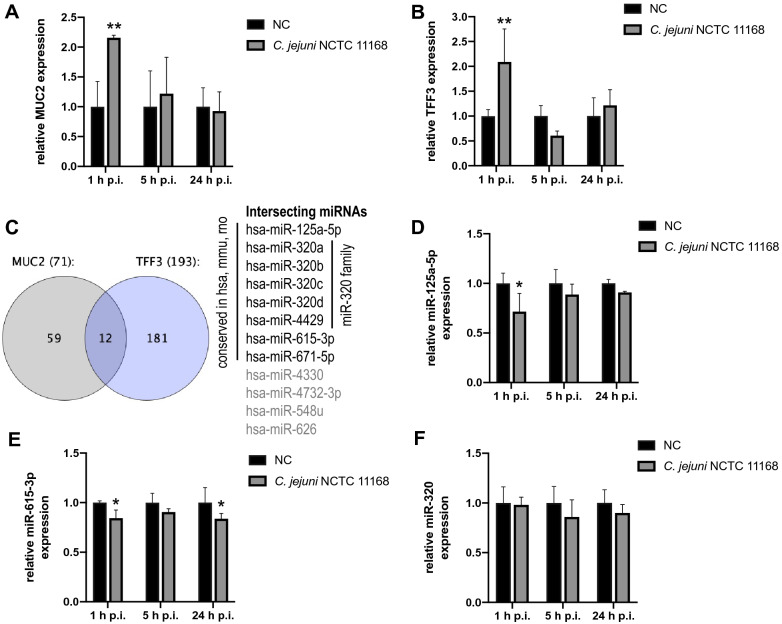
Prediction of MUC2-TFF3-associated miRNAs and relative mRNA expression of MUC2 and TFF3 along with relative expression of selected miRNAs in HT-29/B6 cells after C. jejuni NCTC 11168 infection. A, B Fold changes of MUC2 and TFF3 mRNA expression were relatively calculated to non-infected controls and normalised with ACTB and B2M. C The Venn diagram shows the predicted numbers of MUC2-TFF3-associated miRNAs (12 miRNAs in the intersection). From those only miRNAs were selected that were conserved among human, mouse and rat. D–F Relative fold changes of miR-125a-5p, miR-615-3p and miR-320 at transcript level were calculated to non-infected controls and normalised with SNORD44 and SNORD47. Experiments were performed in triplicate and columns show the mean ± SD (bars). Asterisks represent a statistical significance compared to negative controls at each time point. *P ≤ 0.05, **P ≤ 0.01, unpaired t-test

