Fig. 4.
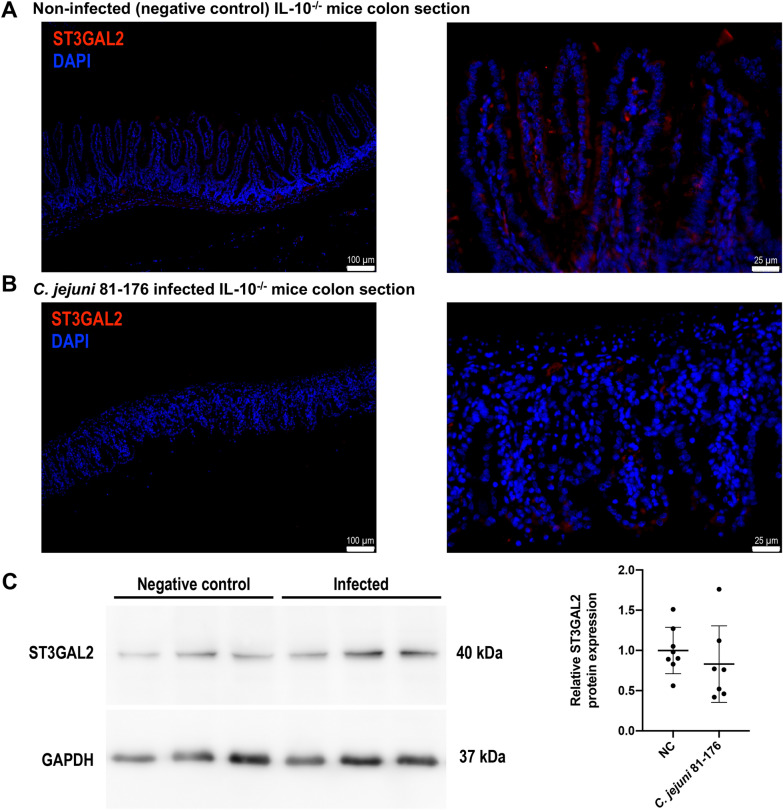
Detection of protein expression of ST3GAL2 in colonic tissue of secondary abiotic IL-10−/− mice upon C. jejuni 81–176 infection. A, B Representative micrographs comparing ST3GAL2 immunofluorescence results in the colonic tissue of naïve mice (A) and C. jejuni 81-176-infected mice (B). ST3GAL2 was immunofluorescently labelled in red and nuclei was stained with DAPI in blue. Micrographs at left side are at magnification 10 × (Scale bar 100 μm) and right side at higher magnification 40× (scale bar 25 μm) and exposure time were the same in all sections. Data are representative for three biological replications. C Right panel exemplifies detection of ST3GAL2 from three individual replicates of infected and non-infected mouse colonic tissue via Western blotting. GAPDH is shown as respective loading reference. ST3GAL2 protein bands were quantified by densitometry relative to the respective GAPDH signals. Charts represent means of at least seven biological replicates ± SD, unpaired t-test

