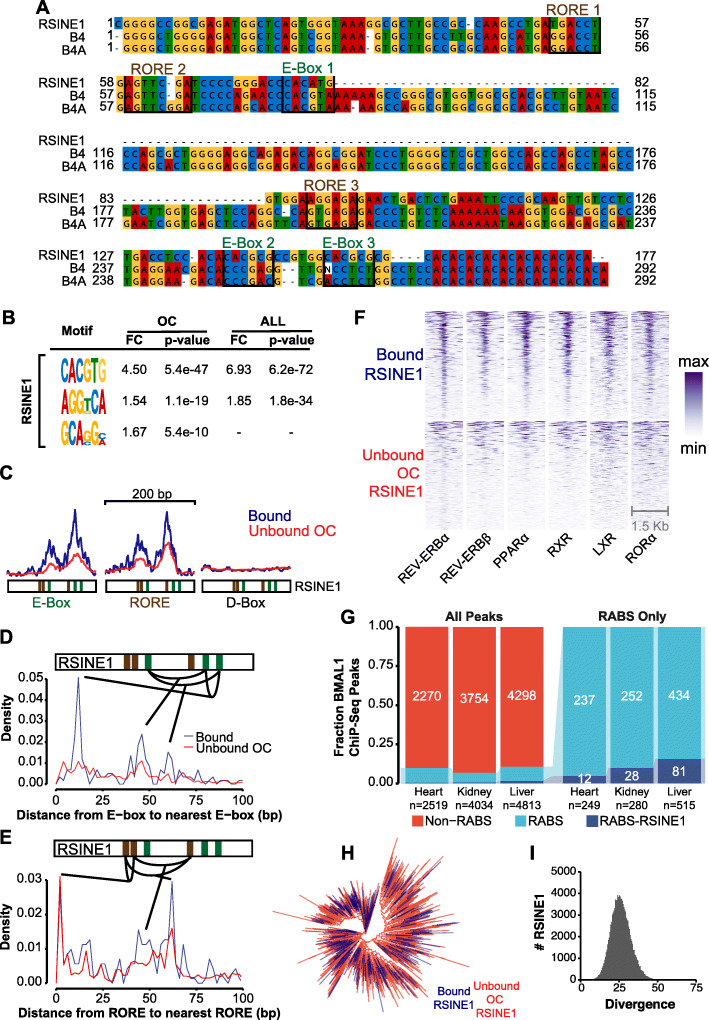
Fig. 4.
RSINE1 elements contain unique motif composition. A Multiple sequence alignment of B4 family SINES. RORE and E-Box pre-motifs are highlighted. B Motifs enriched in bound RSINE1 elements relative to unbound RSINE1 elements which reside in open chromatin (OC), or relative to all RSINE1 elements (ALL). The motif enrichment calculation was also performed using 500 bp of flanking sequences. C Density of D-Box (TTATGYAA), E-Box (CACRTG), and RORE (RGGTCA) motifs within bound (blue line; n = 328) and unbound OC (red line; n = 4279) classes of RSINE1 elements. Plots are centered on RSINE1s and extended 100 bp in either direction. D Average density of the distance from each E-Box and the next closest E-Box in bound RSINE1 elements (n = 328) and unbound open chromatin RSINE1 elements (n = 4279). E As in D, but density of the distance from each RORE to the next closest RORE motif. F ChIP-seq signal strength for various NRs centered at CR-bound RSINE1 elements (n = 328) or a randomly selected subset of unbound OC RSINE1 elements (n = 328). Sort order is maintained across columns; color is scaled relative to min-to-max for each individual factor (column). G Fraction of BMAL1 ChIP-seq peaks in the mouse heart, kidney, and liver which are (RABS) or are not (Non-RABS) associated with repetitive elements by > 50% overlap (left panel). Fraction of RABS which are or are not associated with RSINE1 elements (right panel) in each tissue. H Maximum likelihood tree of all CR-bound RSINE1 elements (n = 328) and a randomly selected set of unbound RSINE1 elements (n = 1000) (see the “Methods” section). I Histogram of divergence from the consensus of all RSINE1 insertions (Kimura 2-parameter)

