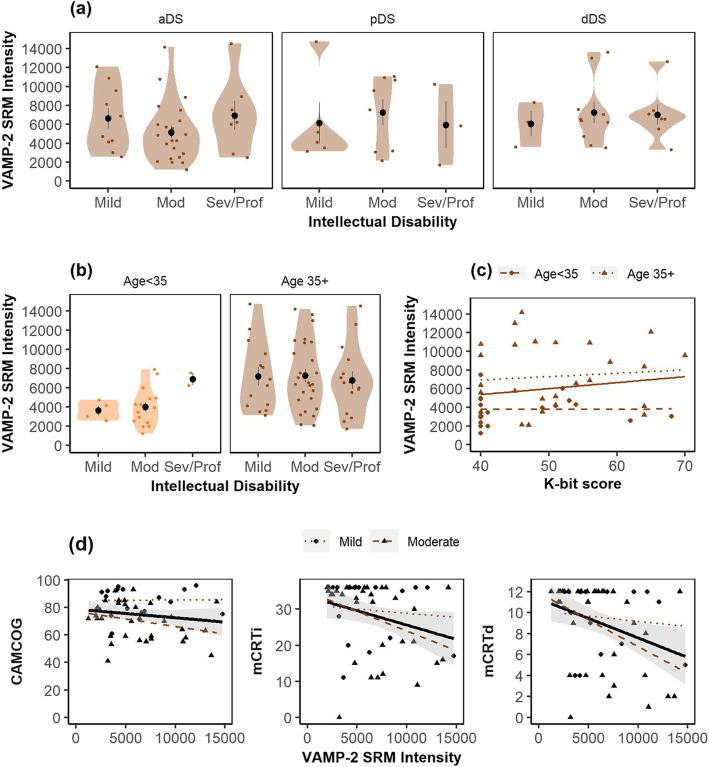
Fig. 3.
Relationship between CSF VAMP-2 and measures of intellectual impairment and cognitive performance in DS. Violin plots show the distribution of CSF VAMP-2 SRM intensities in adults with DS grouped according to degree of intellectual disability and a AD diagnosis and b age group. Circles represent mean intensities and error bars represent standard error of the mean. VAMP-2 SRM intensities in adults with DS are plotted against quantitative measures of intellectual disability (c) and cognitive performance (d). Linear regression lines are shown for models in total DS dataset and standard error of the regression lines are shown as shaded region. Regression lines for individuals aged < 35 or aged 35+ (c) or with mild or moderate ID (d) are also shown (see legends)

