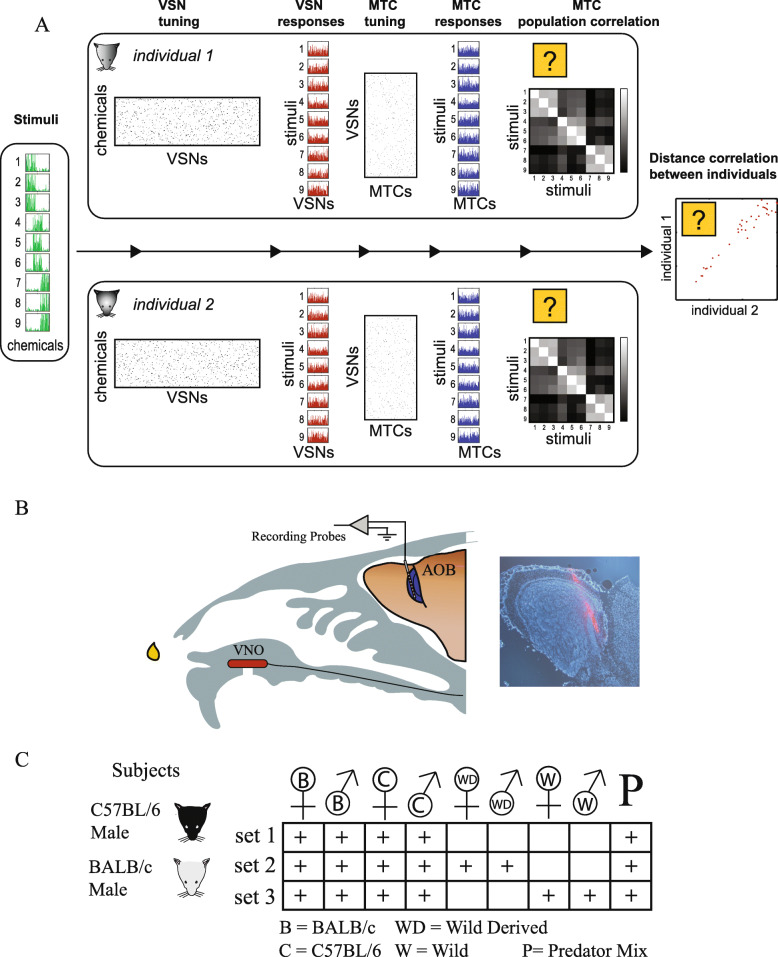
Fig. 1.
Experiment design. a The conceptual framework for our analyses. The figure describes key stages in the processing of complex stimuli by the VNS. In this manuscript, we focus on the distance between representations of distinct stimuli as illustrated by the correlation matrices and on the distance between the representations across different strains of mice. Both aspects are illustrated by the question marks. See the “Introduction” section for a detailed explanation of this panel. b Schematic of the experimental preparation for recording AOB responses. The inset shows an image of a DiI-colored electrode tract in the external cell layer of the AOB. c Stimulus name legend and stimuli used in each of the three datasets in the manuscript. The + signs indicate stimuli that were included in each data set. Male and female symbols indicate the sex of the stimulus donor, and the letters within them indicate the strain, as defined at the bottom of the table. Subject icons indicate the strain of the mouse from which recordings were made. These stimulus and subject symbols are used in other figures throughout the manuscript

