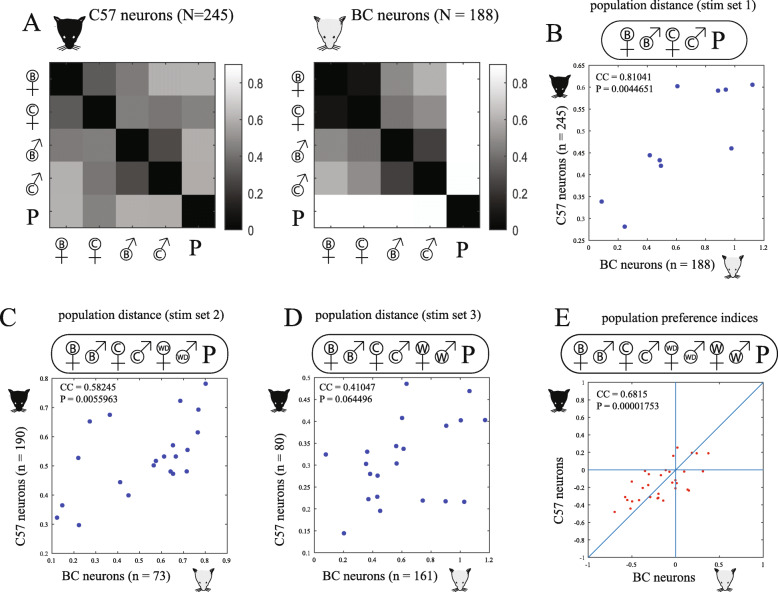
Fig. 4.
Comparison of responses in each of the two strains. a Population-level correlation distance matrices (i.e., low correlations are associated with large distances) for each of the 5 stimuli in set 1, for neurons recorded in C57 and BC mice. b Correlation between pairwise correlation distances, that is, between corresponding squares in the matrices in a. c Like b but for stimulus set 2 which includes more stimuli (see Fig. 1c). d Like b but for stimulus set 3. e Correlation between population pairwise preference indices for all stimulus pairs except for the four comparisons between wild and wild-derived stimuli, which were never presented in a single stimulus set (resulting in a total of 32 pairwise preference indices: (9•8/2) – 4 = 32, see Fig. 1c). Sample sizes vary for different stimulus pairs but are at least as large as those in panels b–d. See Additional File 3 for the same analysis using alternative population distance metrics

