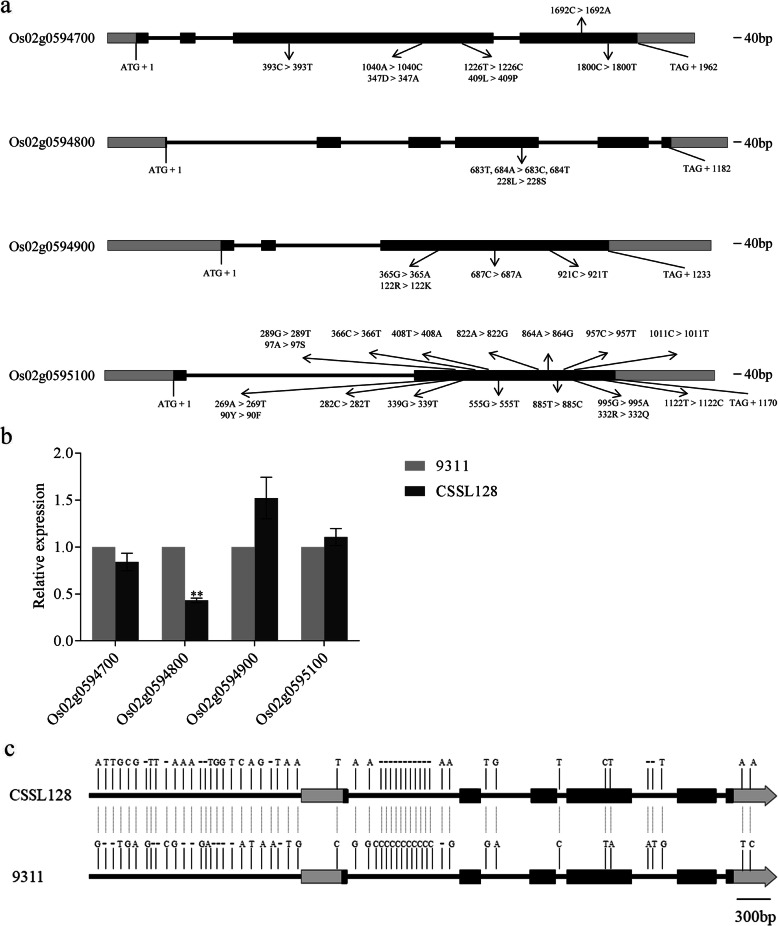
Fig. 4.
Analysis of four candidate genes. a Comparison of CDS and protein sequences of four candidate genes between 9311 and CSSL128. b Comparison of expression levels of four candidate genes between 9311 and CSSL128. **Significance at p < 0.01. c Comparison of the genomic sequence of Os02g0594800 between 9311 and CSSL128. The variations between 9311 and CSSL128 are indicated in this figure. Black bars represent 5′ upstream regions and introns, light-gray bars represent 5′ and 3′ untranslated regions, dark-gray bars represent coding regions, the short dashes represent single base pair deletions

