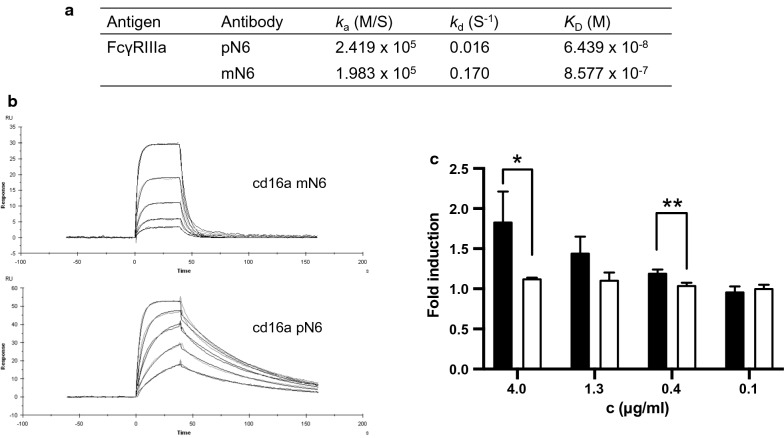
Fig. 5.
N6 Fc effector function assessment. A Binding kinetics of FcγRIIIa to pN6 and mN6 measured by surface plasmon resonance. Protein A was immobilised onto a CM5 chip and N6 antibody was captured to 5000 RU. Association constant (ka), dissociation constant (kd) and affinity (KD) were estimated using the Langmuir model of binding (1:1), with BIAcore™ Evaluation software. B Surface plasmon resonance measuring binding kinetics of pN6 compared to mN6. C Antibody dependent cellular cytotoxicity (ADCC) assay comparing activation of ADCC by pN6 (black) with mN6 (white). ADCC is detected by reporter effector cells expressing luciferase when activated. Results are from 3 technical replicates ± S.D. Statistical analyses carried out using Graphpad Prism software Student’s T-test. * p ≤ 0.05. ** p ≤ 0.006

