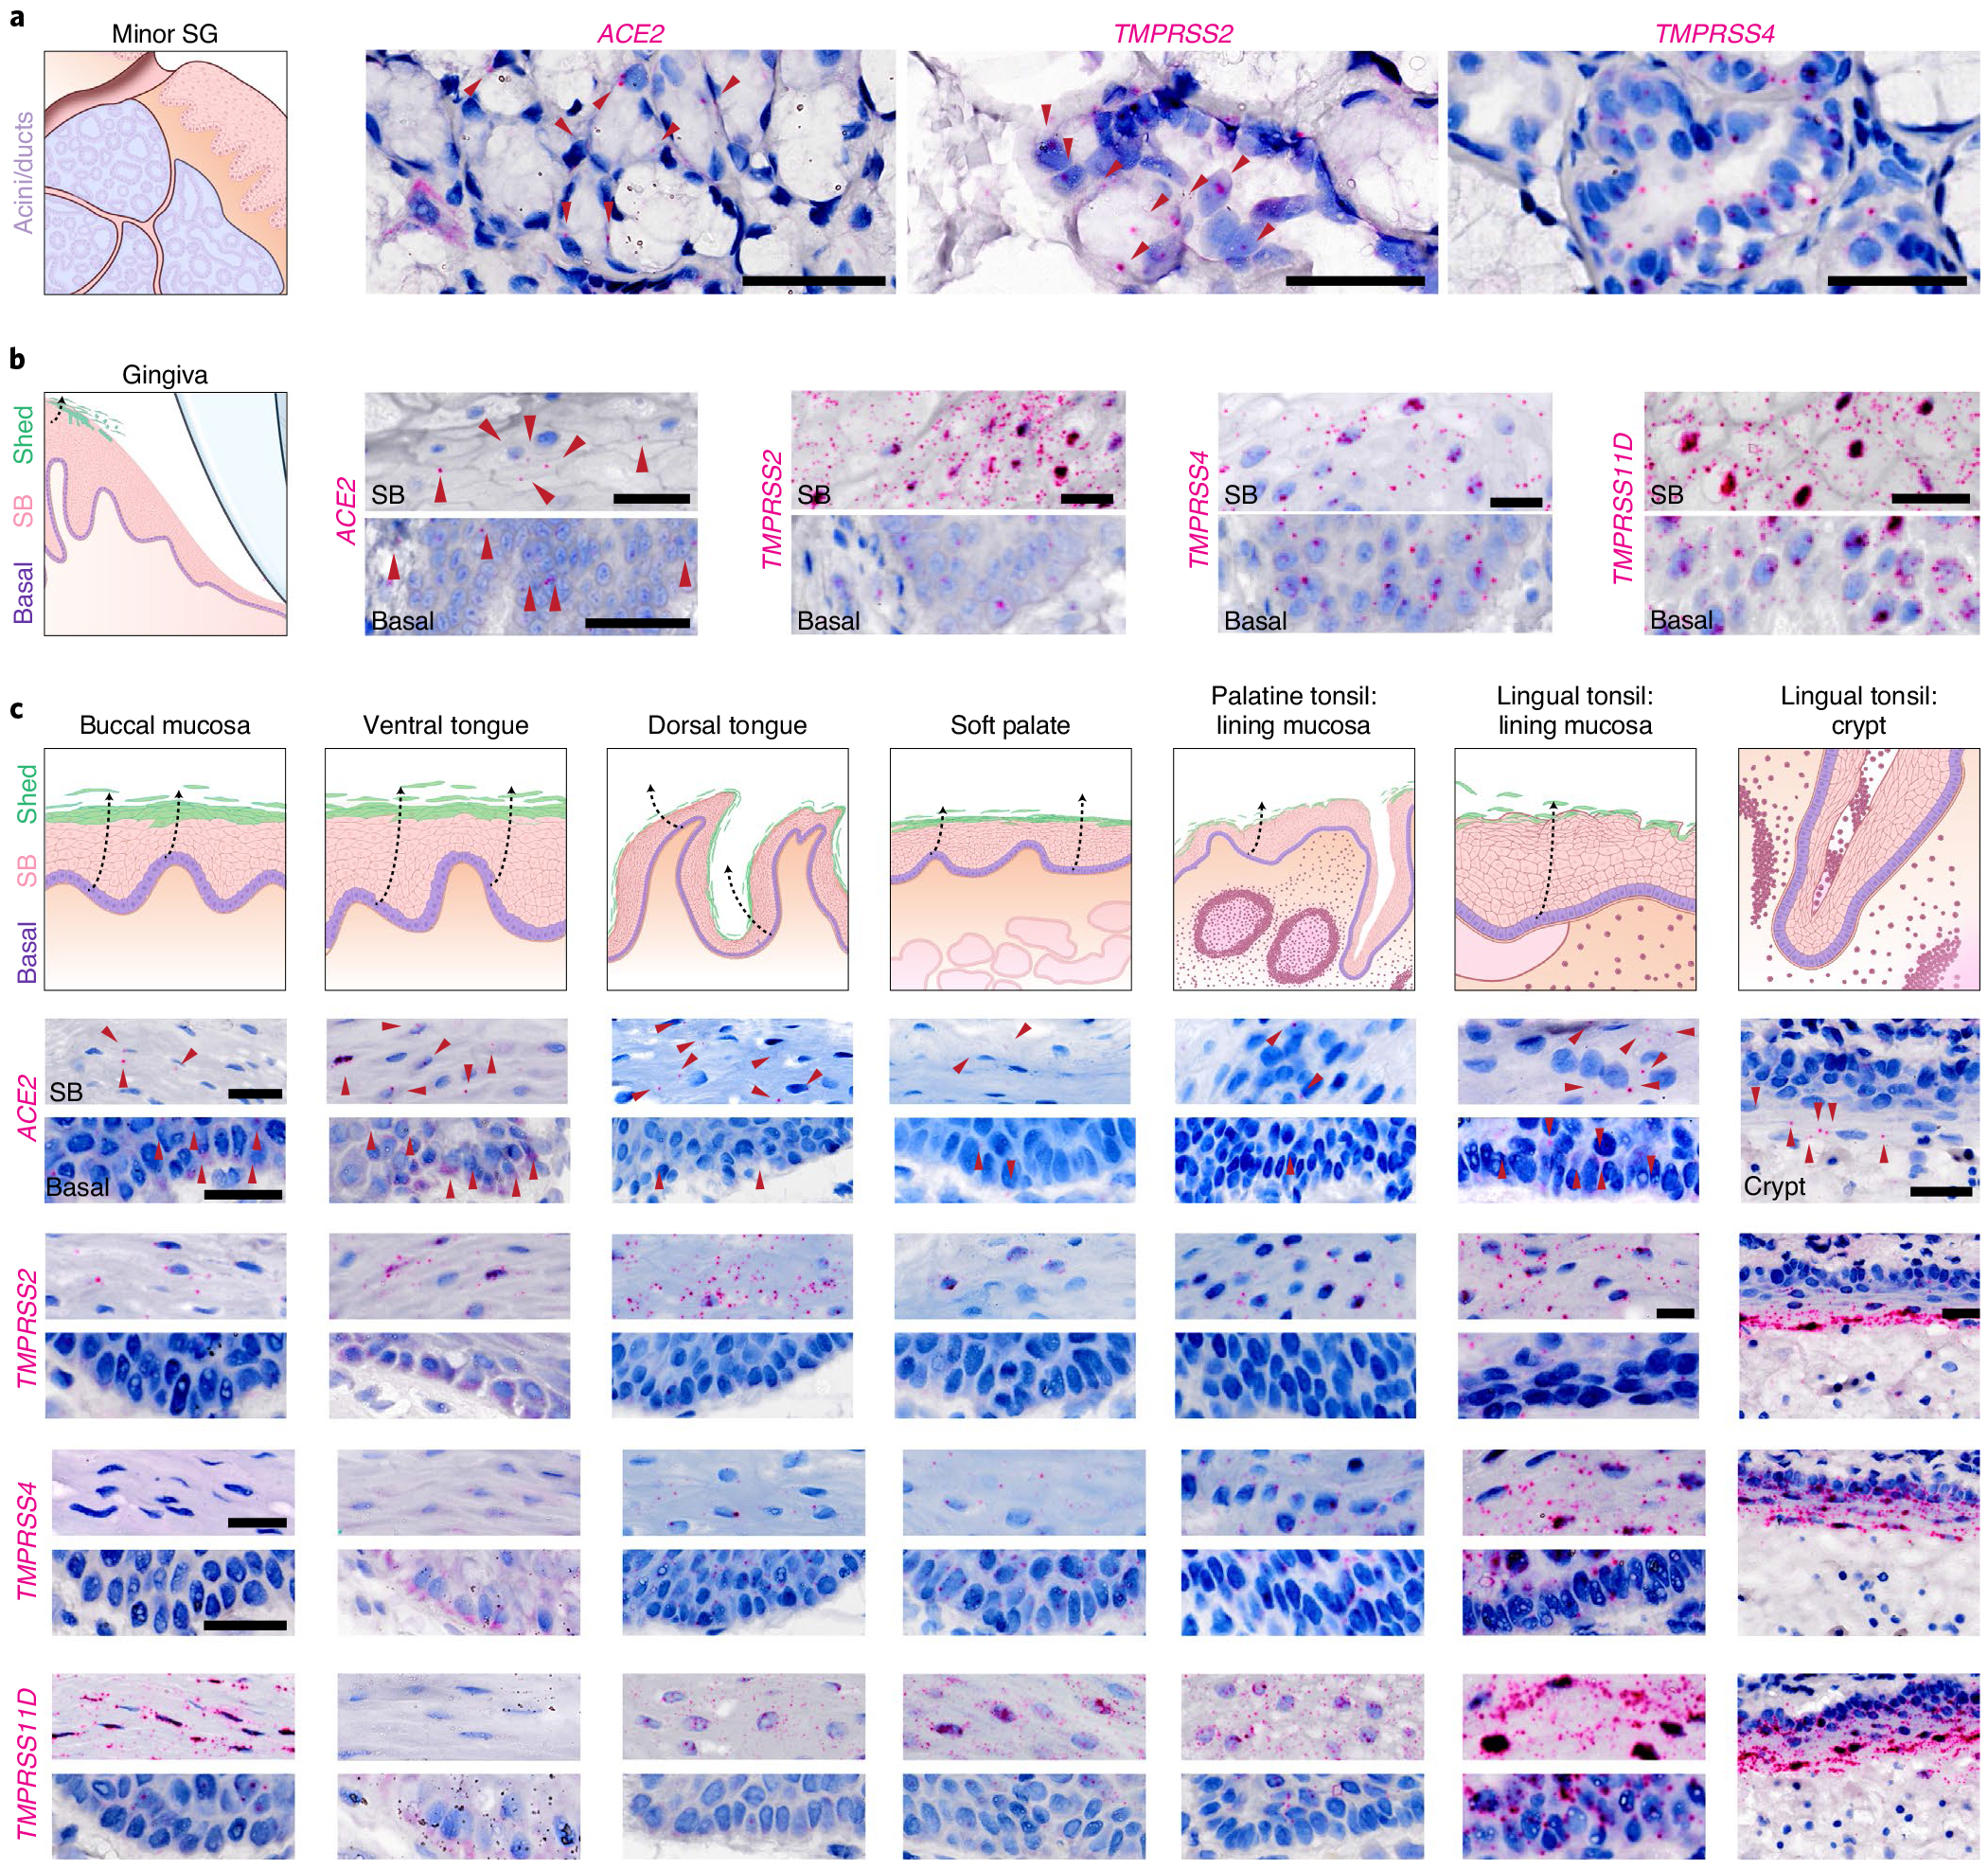
Fig. 3 |. Oral and oropharyngeal ISH mapping supports oral infection by SARS-CoV-2.

a,b, Using healthy volunteer (a) gland and (b) gingival tissue sections, mRNA expression was confirmed using RNAscope ISH for ACE2, TMPRSS2, TMPRSS4 and TMPRSS11D in gingiva; (see TMPRSS11D in SG: Extended Data Fig. 3b); three independent replications for each. b, Owing to the known shedding/sloughing of suprabasal epithelial cells (c, illustrations), we examined both basal and suprabasal (SB) expression, revealing enrichment of all examined entry factors in suprabasal over basal cells. c, Using ISH, we mapped ACE2 and TMPRSS2, TMPRSS4 and TMPRSS11D in diverse oral tissues (buccal mucosa, ventral tongue and the dorsal tongue) and the oropharynx (soft palate and tonsils); three independent replications for oral and two replications for oropharyngeal samples. ISH controls are included in Extended Data Fig. 3f–h. This again supported the heterogeneity that can be found in the oral cavity—not only considering suprabasal over basal enrichment but also across sites. This mapping also revealed that all sites are vulnerable to infection in suprabasal cells that are shed/sloughed into saliva. Arrowheads in a-c indicate high gene expression (red). Scale bars (a-c), 25 μm.
