
Fig. 5 |. Oral mucosal epithelial cells are infected by SARS-CoV-2 and shed into saliva.
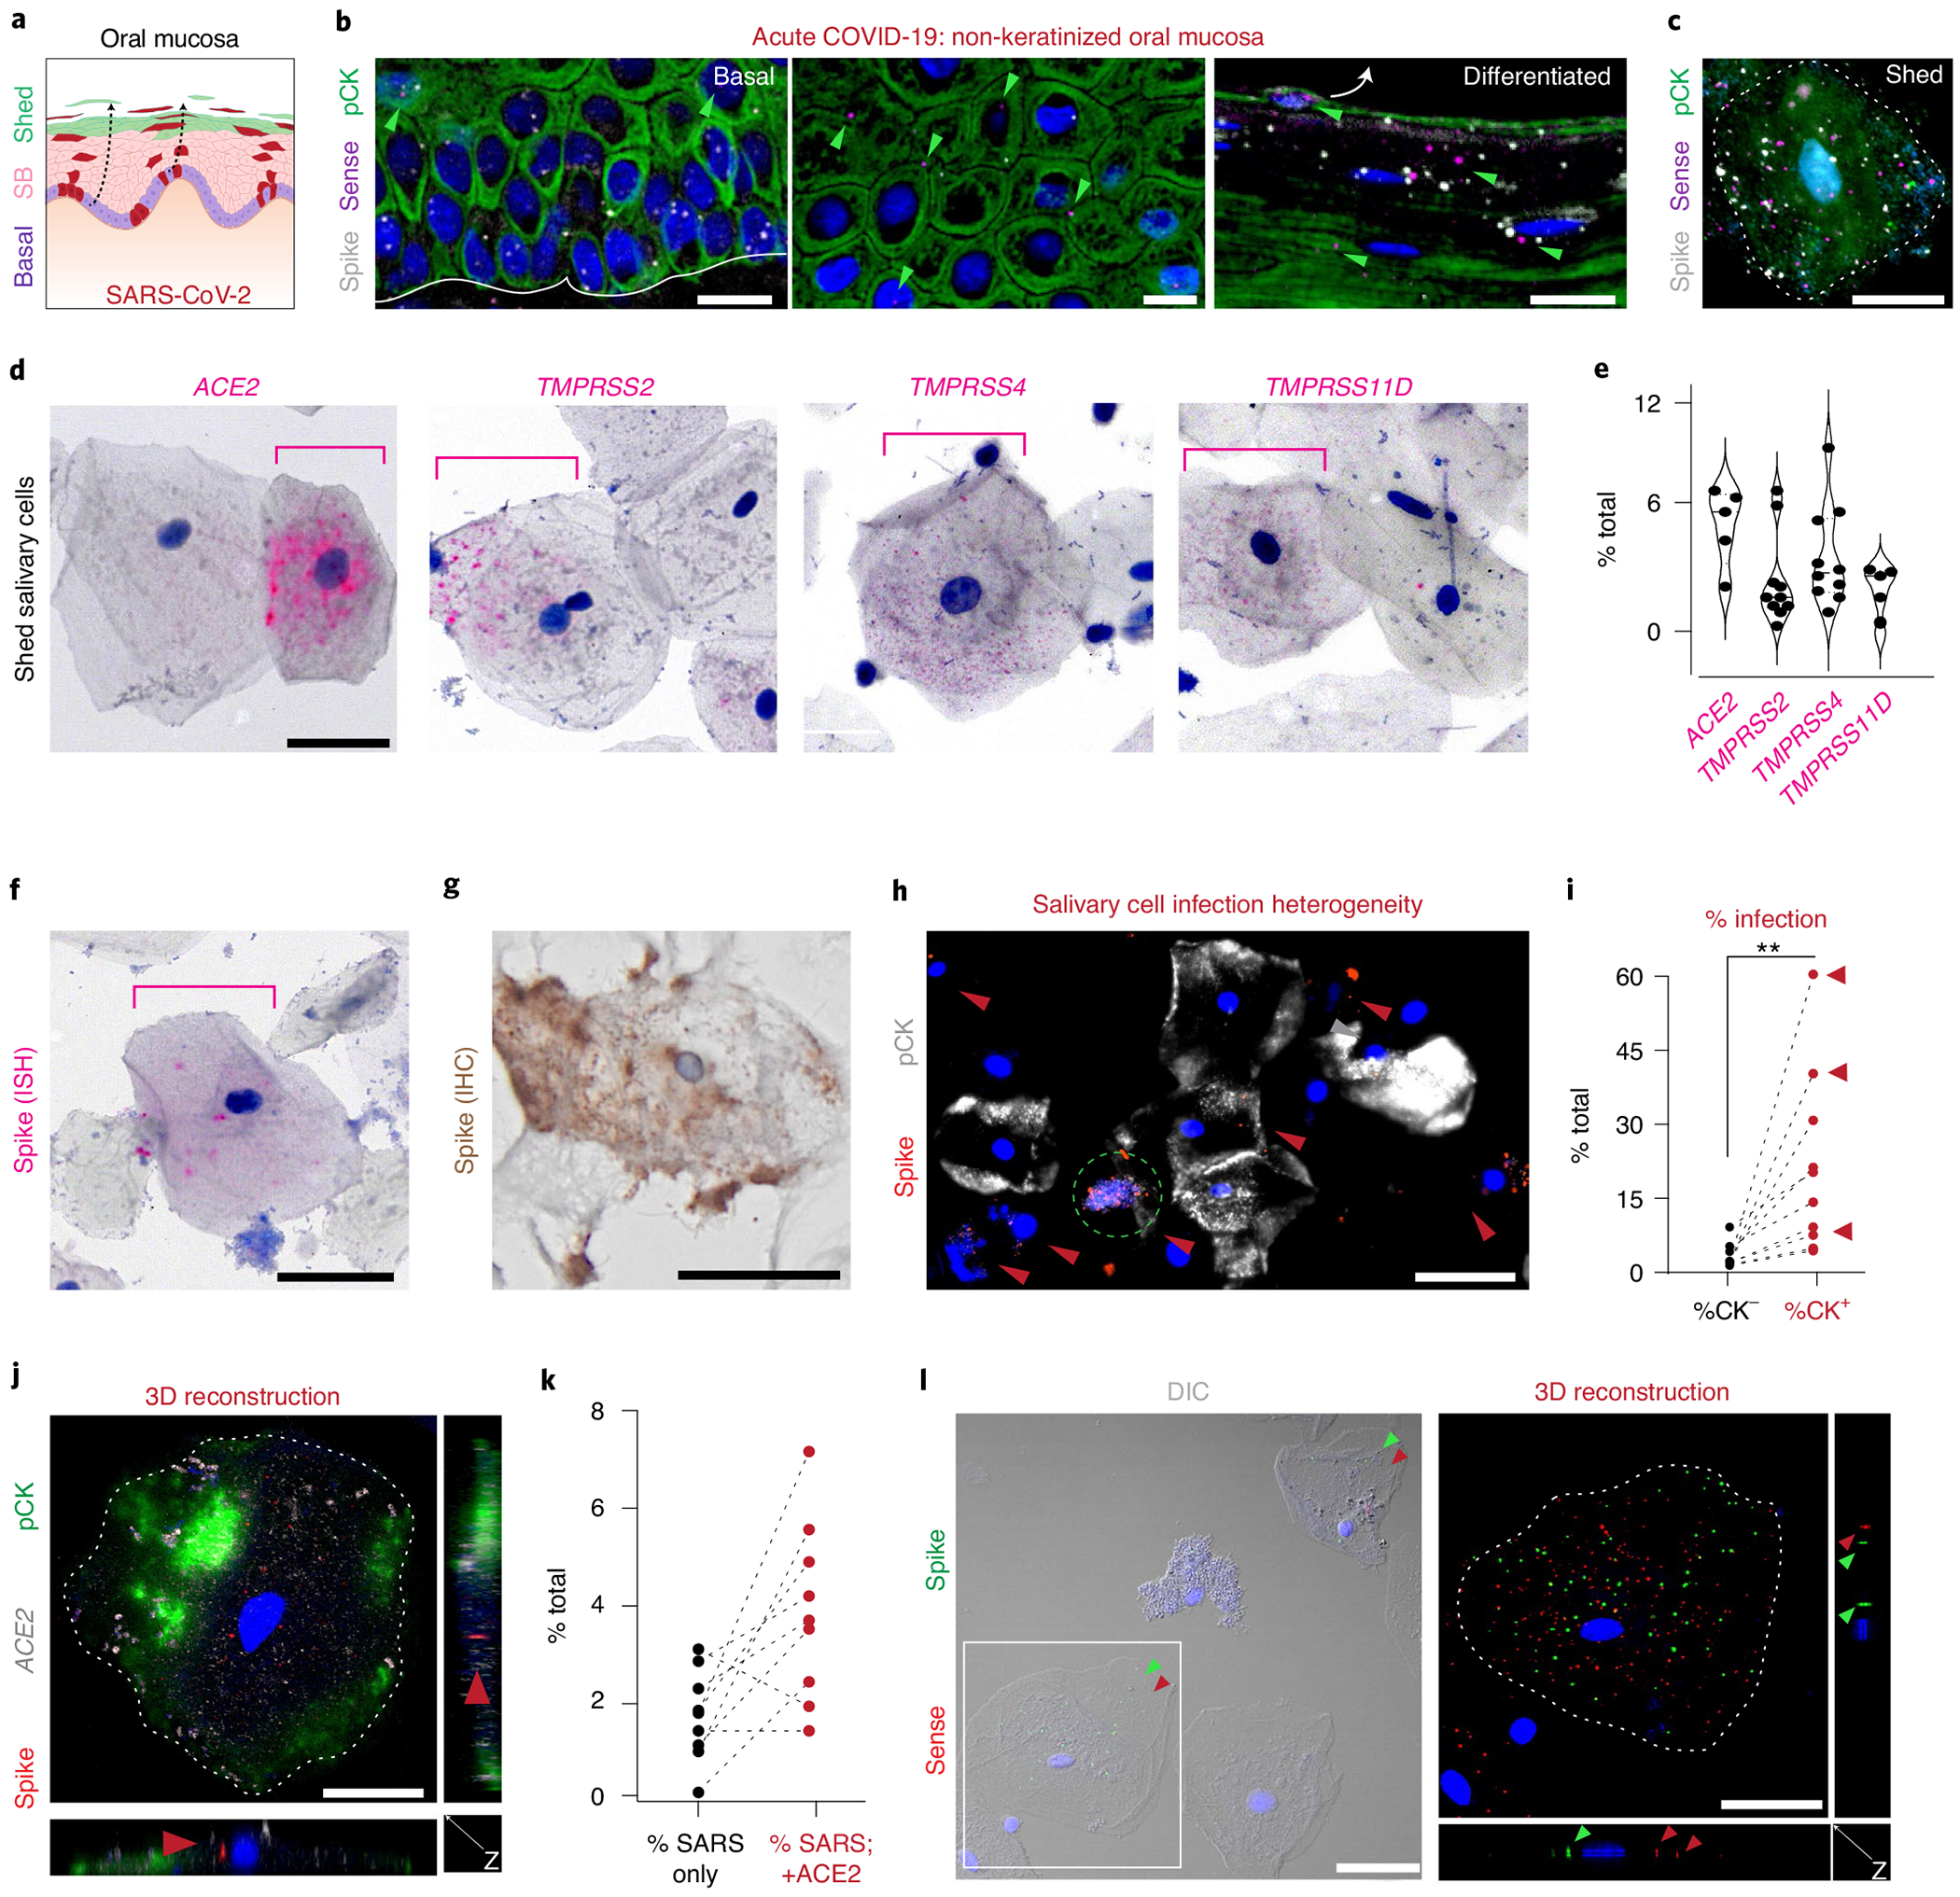
a, We hypothesized that oral mucosae would be infected by SARS-CoV-2. b, Using the overlying mucosa from SG biopsy of CoV49 (Fig. 4), we performed ISH using spike/sense probes to demonstrate infection in basal, suprabasal (SB), and differentiated cells. Like the expression of SARS-CoV-2 entry factors (Fig. 3), replication was found more often in suprabasal layers (one independent replication). c, Mucosal scrapings from CoV49 confirmed infection and replication in cells fated to be shed into saliva (no independent replication). d,e, Salivary epithelial cells were found to express (d) all SARS-CoV-2 entry factors in a minority of cells (n = 5 for ACE2 and TMPRSS11D; n = 10 for TMPRSS2 and TMPRSS4). e, Scatter violin plots highlight percentage of expressing cells per sample from d, with means represented by a thick solid line (5.4, 2.8, 3.9 and 2.4; respectively). f-l, Salivary epithelial cells can sustain infection by SARS-CoV-2 using (f) ISH (one independent replication) or (g) IHC (no independent replication). h, Across saliva cells, there is infection heterogeneity of pCK cells (one independent replication). i, Using ten samples collected from outpatients with COVID-19, we confirmed that pCK cells are the primary infected cell population; red arrows point to individuals with loss of taste (n = 10 with two independent replications; two-tailed paired t-test P=0.01). j, SARS-CoV-2 infection more often occurs in ACE2+ cells. Using 3D confocal microscopy, we demonstrated the virus inside of these cells, (k) most of which were ACE2+ (two independent replications). l, These epithelial cells were found to sustain viral replication inside the cells (two independent replications). The solid white line in b represents basement membrane; the white arrow in b represents differentiated cell trajectory. Dotted white lines (c, j and l) highlight cell membranes; the dotted green circle (h) indicates possibly CK+ cell undergoing cell death; red arrowheads (h, j and l) represent SARS-CoV-2 infection, and green arrowheads (b and l) represent SARS-CoV-2 replication. DIC, differential interference contrast microscopy. Scale bars: b, h and l left, 25 μm; c, d, f, g, j and l right, 10 μm. Statistical test (i): **P ≤ 0.001.