
Extended Data Fig. 2 |. RNA sequencing reveals common viral infection susceptibilities.
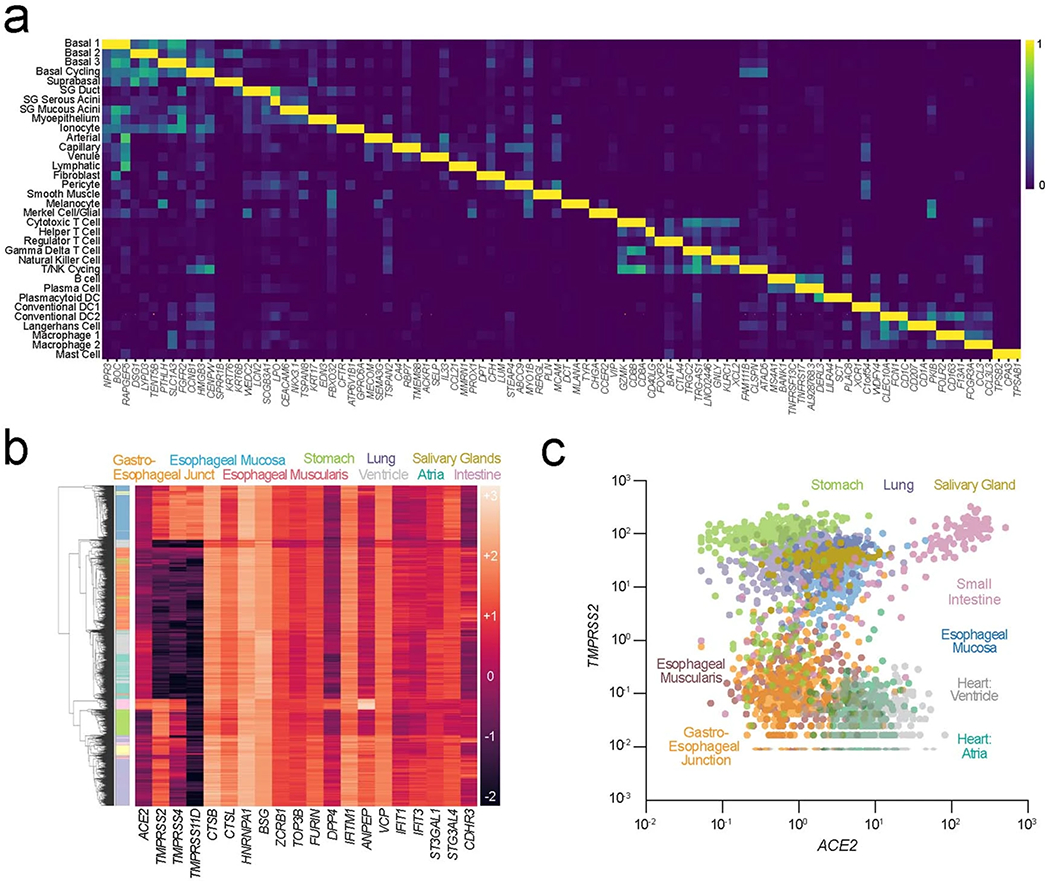
a, Expression matrix visualization of the integrated human oral atlas illustrates that cell types are distinguished by unique—and for some oral cell populations—as of yet, undescribed transcriptional signatures (defining list in Supplementary Table 1). b,c, (b) GTEx v7 RNA-seq data was used to construct a heatmap to visualize and compare the expression of viral entry factors across available tissue types including the esophagus, heart, lung, salivary gland, small intestine, and stomach. Salivary glands cluster with lung, small intestine, and stomach—all known tissues with tropism for SARS-CoV-2. c, Comparison of ACE2 and TMPRSS2 co-expression shows distinct clusters of tissues at risk of infection based on co-expression, including salivary glands clustering with the lungs and stomach—known sites of infection.