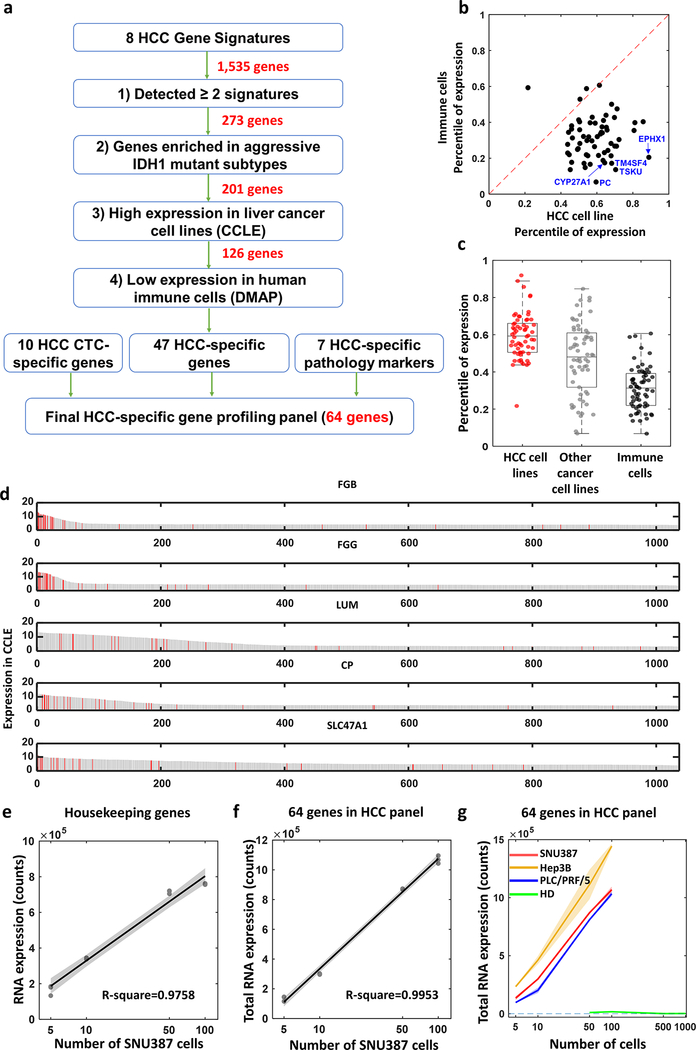
Figure 3. Development and validation of of hepatocellular carcinoma (HCC)-specific gene panel with 64 genes.
a) An integrated data analysis framework adopted for selecting and developing the 64 genes of HCC-specific gene panel. b) Scatter plot shows expression of the 64 genes comparing HCC cell lines to humane immune cells. Dotted line indicates the same expression between HCC cells and other cancer cells which is y=x axis. c) Box plot depicts differential expression of 64 genes between HCC cell lines (red dots), other cancer cell lines (gray dots) from Cancer Cell Line Encyclopedia (CCLE), and humane immune cells from Differentiation MAP dataset (DMAP) (black dots). d) Bar charts show distribution of all the cells in CCLE based on the expression level of the genes (i.e., FGB, FGG, LUM, CP, SLC47A1). Red bar indicates HCC cell lines. e, f) Dots with regression line depict expression dynamics of housekeeping genes (e, R2 = 0.976) and 64 genes (f, R2 = 0.995) was assessed with difference SNU387 cell counts from 0 to 100. g) Line plots with distinct colors represent dynamic changes of the 64 gene expression counts from SNU387, Hep3B, PLC/PRF/5 and healthy donor peripheral blood mononuclear cells (PBMCs) with different cell numbers. Slopes of the curve- SNU387: 9,829.5 counts/cell, Hep3B: 12,744.9 counts/cell, PLC/PRF/5: 9,862.5 counts/cell, healthy donor PBMCs: −8.8 counts/cell.

