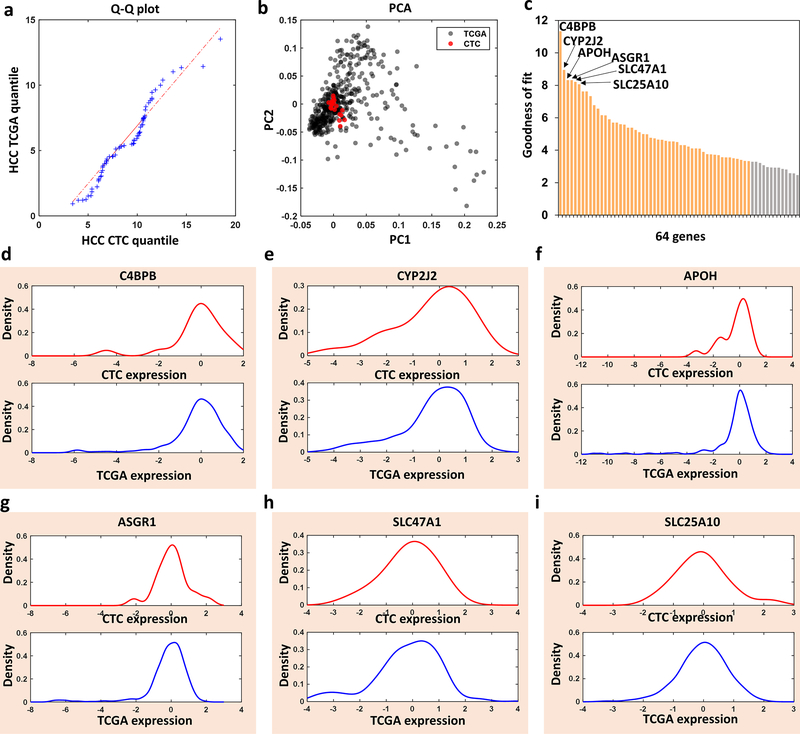
Figure 4. Bioinformatic analysis and comparison of the 64-gene mRNA signatures of hepatocellular carcinoma (HCC) circulating tumor cells (CTCs) purified by Click Chips from HCC patients and HCC tissue mRNA signatures from The Cancer Genome Atlas (TCGA) database.
a) Q-Q Plot showed that the 64-gene expression profiles from the HCC CTCs and HCC TCGA came from populations with a common distribution. b) PCA plot based on the 64-gene expression from the HCC CTCs from 20 patients (red dots) and HCC TCGA (gray dots). c) Bar charts showed the goodness of fit (inverse KS distance) of the 64 genes between the HCC CTCs and HCC TCGA. d-i) Kernel density plot of the 6 representative genes with the highest expression concordance between HCC CTCs and HCC TCGA.

