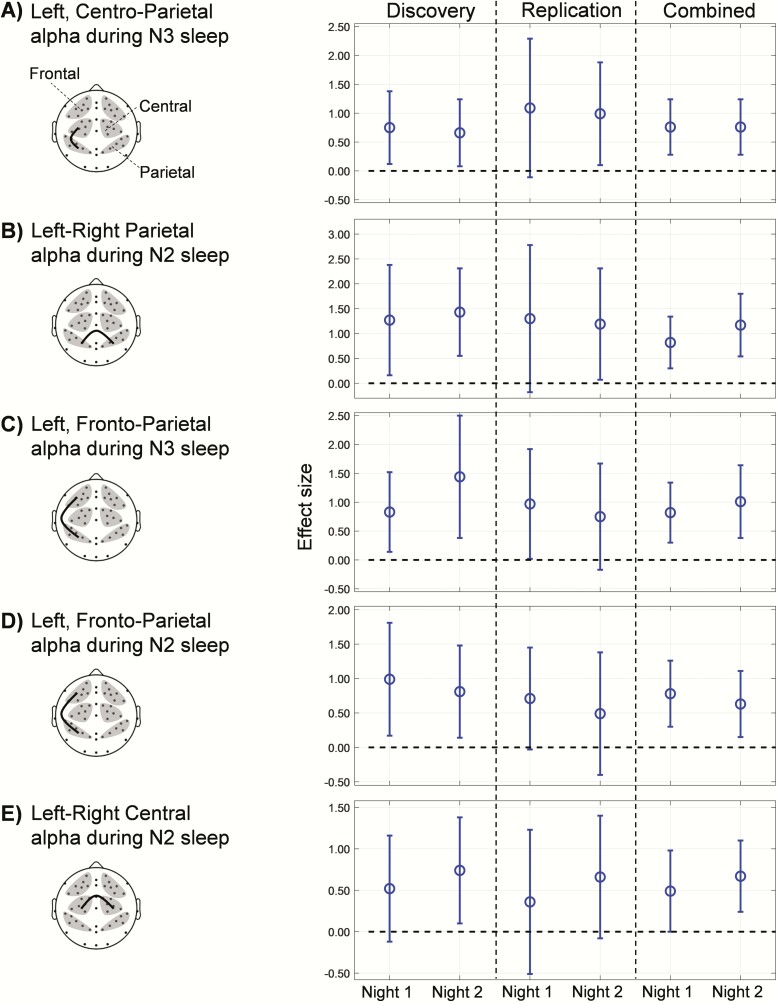
Figure 4.
Comparisons of effect sizes for the five WPLI synchrony features across the three analysis sets (discovery, replication, and combined). Open circles denote effect sizes (Cohen’s robust d; positive values indicate that the WPLI is larger in PTSD subjects than in non-PTSD subjects). Error bars indicate the 95% CIs of the effect sizes; the dashed lines indicate an effect size of zero. The effect sizes of the replication set fell within the CIs of the discovery set for all five features. The lower bound of the 95% CIs of the effect sizes for the combined set is at or above the zero dashed line, indicating that the observed effects are significant.

