Figure 4.

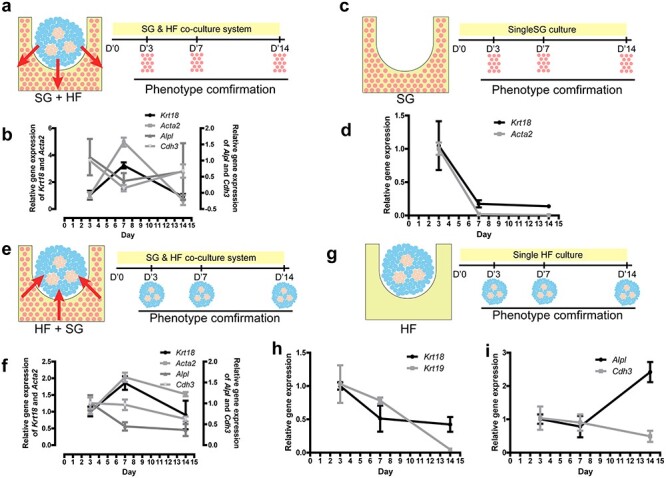
The reciprocal effects between sweat glands (SGs) and hair follicles (HFs) in the time sequential test. (a) Schematic diagram showing the impact of HF spheroids on SG scaffolds and the sampling time points. (b) Gene expression of SG and HF markers in SG scaffolds after 3-, 7- and 14-day co-culture of HF spheroids seeded on SG scaffolds (n = 3, one-way ANOVA followed by Bonferroni’s multiple comparison test; for statistical significance refer to Table S5). (c) Schematic diagram shows single SG scaffolds cultured in a dish and its sampling time points. (d) Gene expression of SG markers in SG scaffolds after 3-,7- and 14-day culture without HF spheroids (n = 3, one-way ANOVA followed by Bonferroni’s multiple comparison test; for statistical significance refer to Table S6). (e) Schematic diagram shows SG scaffolds impacts on HF spheroids and its sampling time points. (f). Gene expression of SGs and HFs in HF spheroids after 3-, 7- and 14-day culture of HF spheroids seeded on SG scaffolds (n = 3, one-way ANOVA followed by Bonferroni’s multiple comparison test; for statistical significance refer to Table S7). (g) Schematic diagram shows single HF spheroids cultured in AG scaffolds and the sampling time points. Gene expression of SGs (h) and HFs (i) in HF spheroids after 3-, 7- and 14-day culture without SG scaffolds (n = 3, one-way ANOVA followed by Bonferroni’s multiple comparison test; for statistical significance refer to Table S8). SG+HF group means SG scaffolds seeded with HF spheroids, SG group means only SG scaffolds, HF+SG group means HF spheroids seeded on SG scaffolds, HF group means only HF spheroids in AG scaffolds
