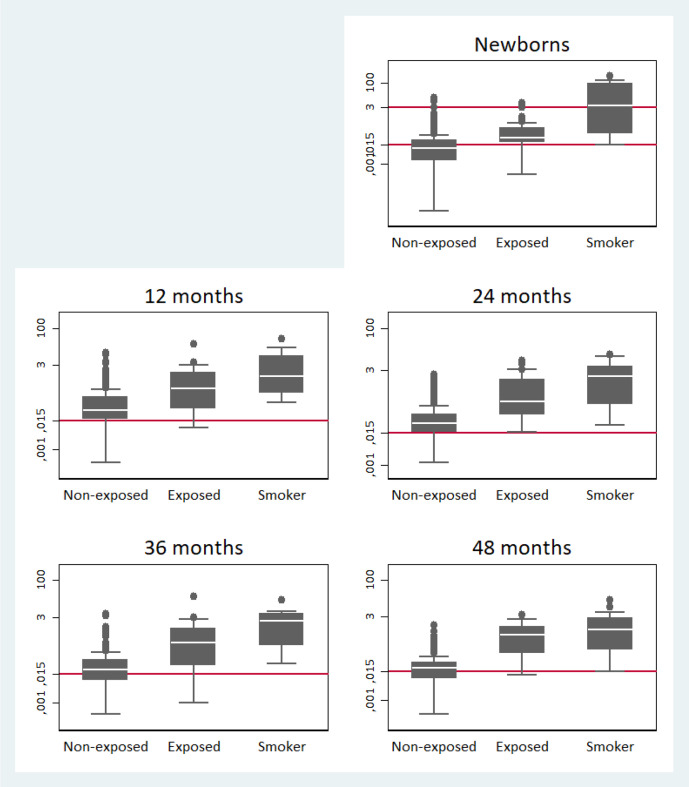
Figure 2.
The box plots depict the distribution of serum cotinine concentrations (ng/mL), as logarithm, from neonatal umbilical cord (upper line=3 ng/mL and bottom line=0.015 ng/mL) and child at 12, 24, 36 and 48 months (line=0.015 ng/mL) depending on children’s SHS exposure reported by mothers (unexposed/exposed/mother smoker). If using the LOD derived cut-point of 0.015 ng/mL to distinguish between SHS exposure/non-exposure, all the children, including those from the non-exposure category, had serum cotinine concentrations comparable with SHS exposure. LOD, limit of detection; SHS, secondhand tobacco smoke.

