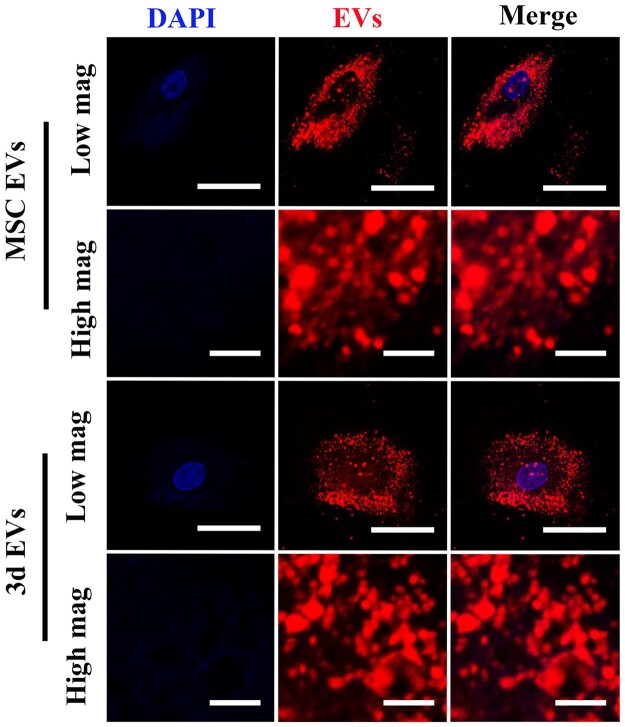
Figure 2.
EVs internalization by CLSM. CLSM images of MSC EVs and 3d EVs uptake by hBMSCs. Isolated EVs were prestained with exosome labeling marker (red), then incubated with hBMSCs. Nuclei were stained with DAPI (blue). Representative CLSM images are shown in the figure (n = 3). low magnification scale bar: 50 μm. High magnification scale bar: 5 μm.

