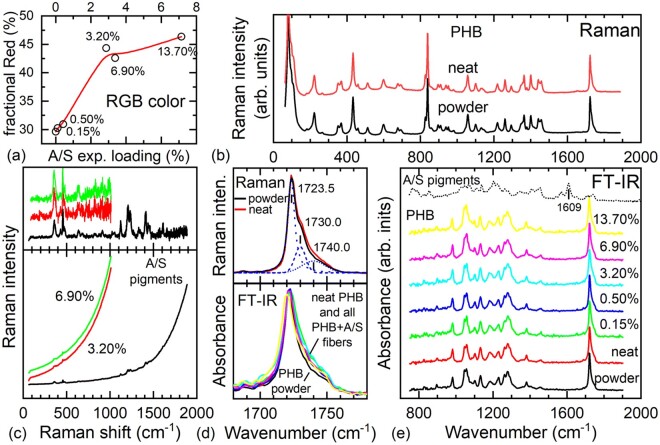
Figure 4.
(a) Average fractional red color content of the as recorded micrographs in Fig. 3 as a function of the experimentally determined drug loading (Table 2). the line through data serves as a guide to the eye. (b) Raman spectra of the PHB initial powder material and the electrospun PHB fibers (neat, 0% A/S mixture content). (c) Raman spectra of solid A/S mixture of pigments and two fibers from samples containing A/S pigments mixture (bottom panel), and after subtraction of the luminescent background (top panel). (d) Raman spectra of the powder and neat electrospun fibers (top panel) and IR absorbance spectra of all samples (bottom panel) in the spectral region of the C = O stretching vibration (∼1725 cm−1). (e) IR absorbance spectra of all samples in the spectral range 750–1900 cm−1. In each plot, all Raman and/or IR spectra are intensity normalized. Labels with percentages inside graphs refer to the theoretical wt.% of the A/S mixture of pigments (Table 1). All Raman spectra were excited using a laser at 515 nm.

