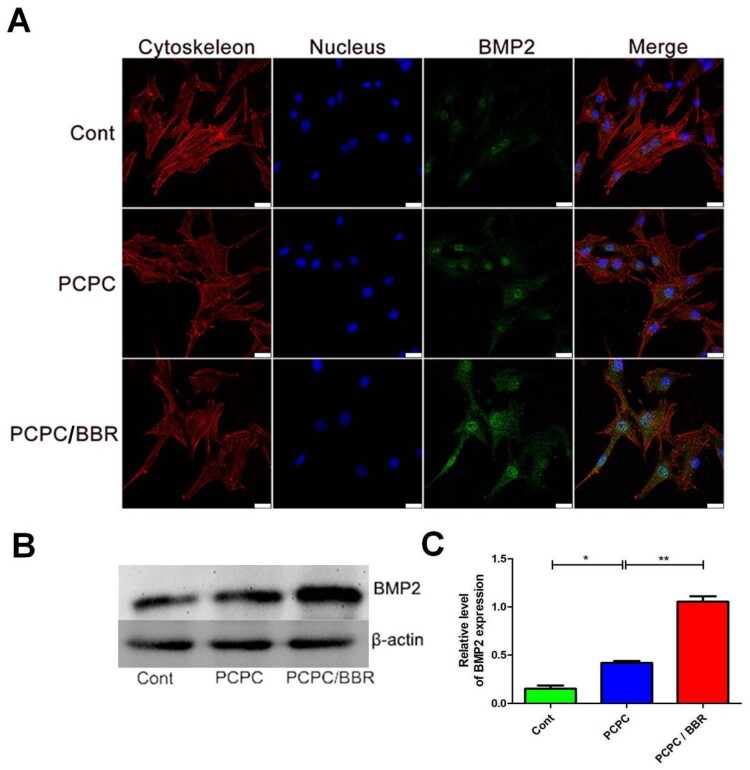
Figure 6.
CLSM images of the level of BMP2. In the image, the PCPC group was cultured with the extract of the PCPC medium, the PCPC/BBR was cultured with the extract of the PCPC/BBR medium, and the control group was cultured in the normal medium. The expression of BMP2 was detected by WB (B). β-actin was used as control (*P < 0.05; **P < 0.01; scale bar: 25 µm).

