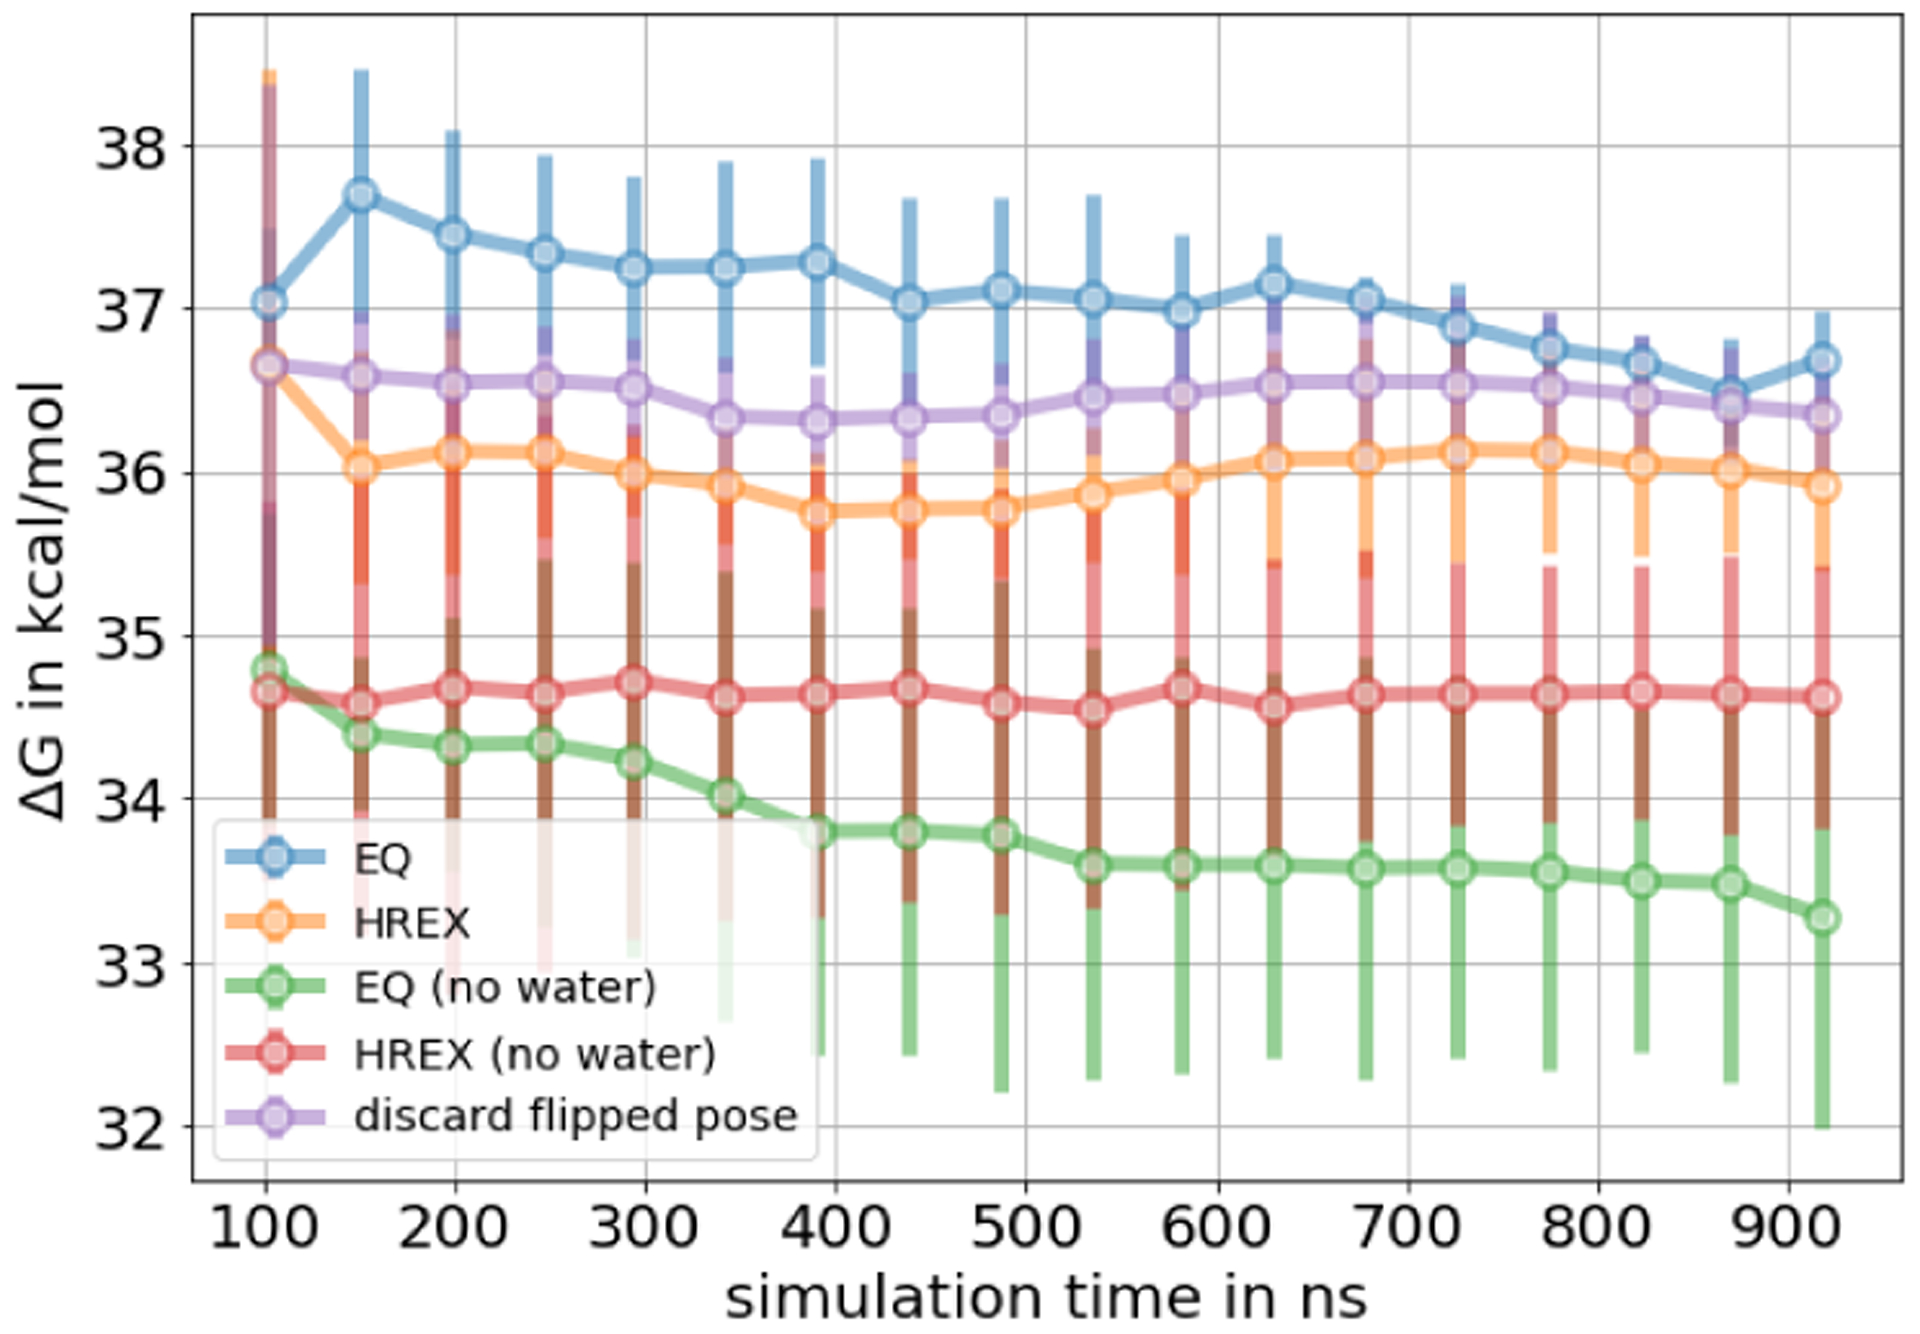
Figure 19.

Mean free energy of the ligand binding to HSP90 as a function of total simulation time. We show the standard EQ approach (blue) and the same EQ protocol, but enhancing the sampling with HREX (orange). The purple line shows the free energy estimate of the HREX protocol after discarding all data that included the flipped binding mode. The flipped binding mode had an impact on the ΔG estimate. A high standard deviation on the HREX protocol indicates that the sampling enhancement here came with its own disadvantages. Green and red lines show simulations where the three buried water molecules were not present in the starting structure. The free energy differences from these calculations differs from the simulations where the buried waters were present (blue, orange, purple) which shows the impact of the binding site waters on the ΔG estimate.
