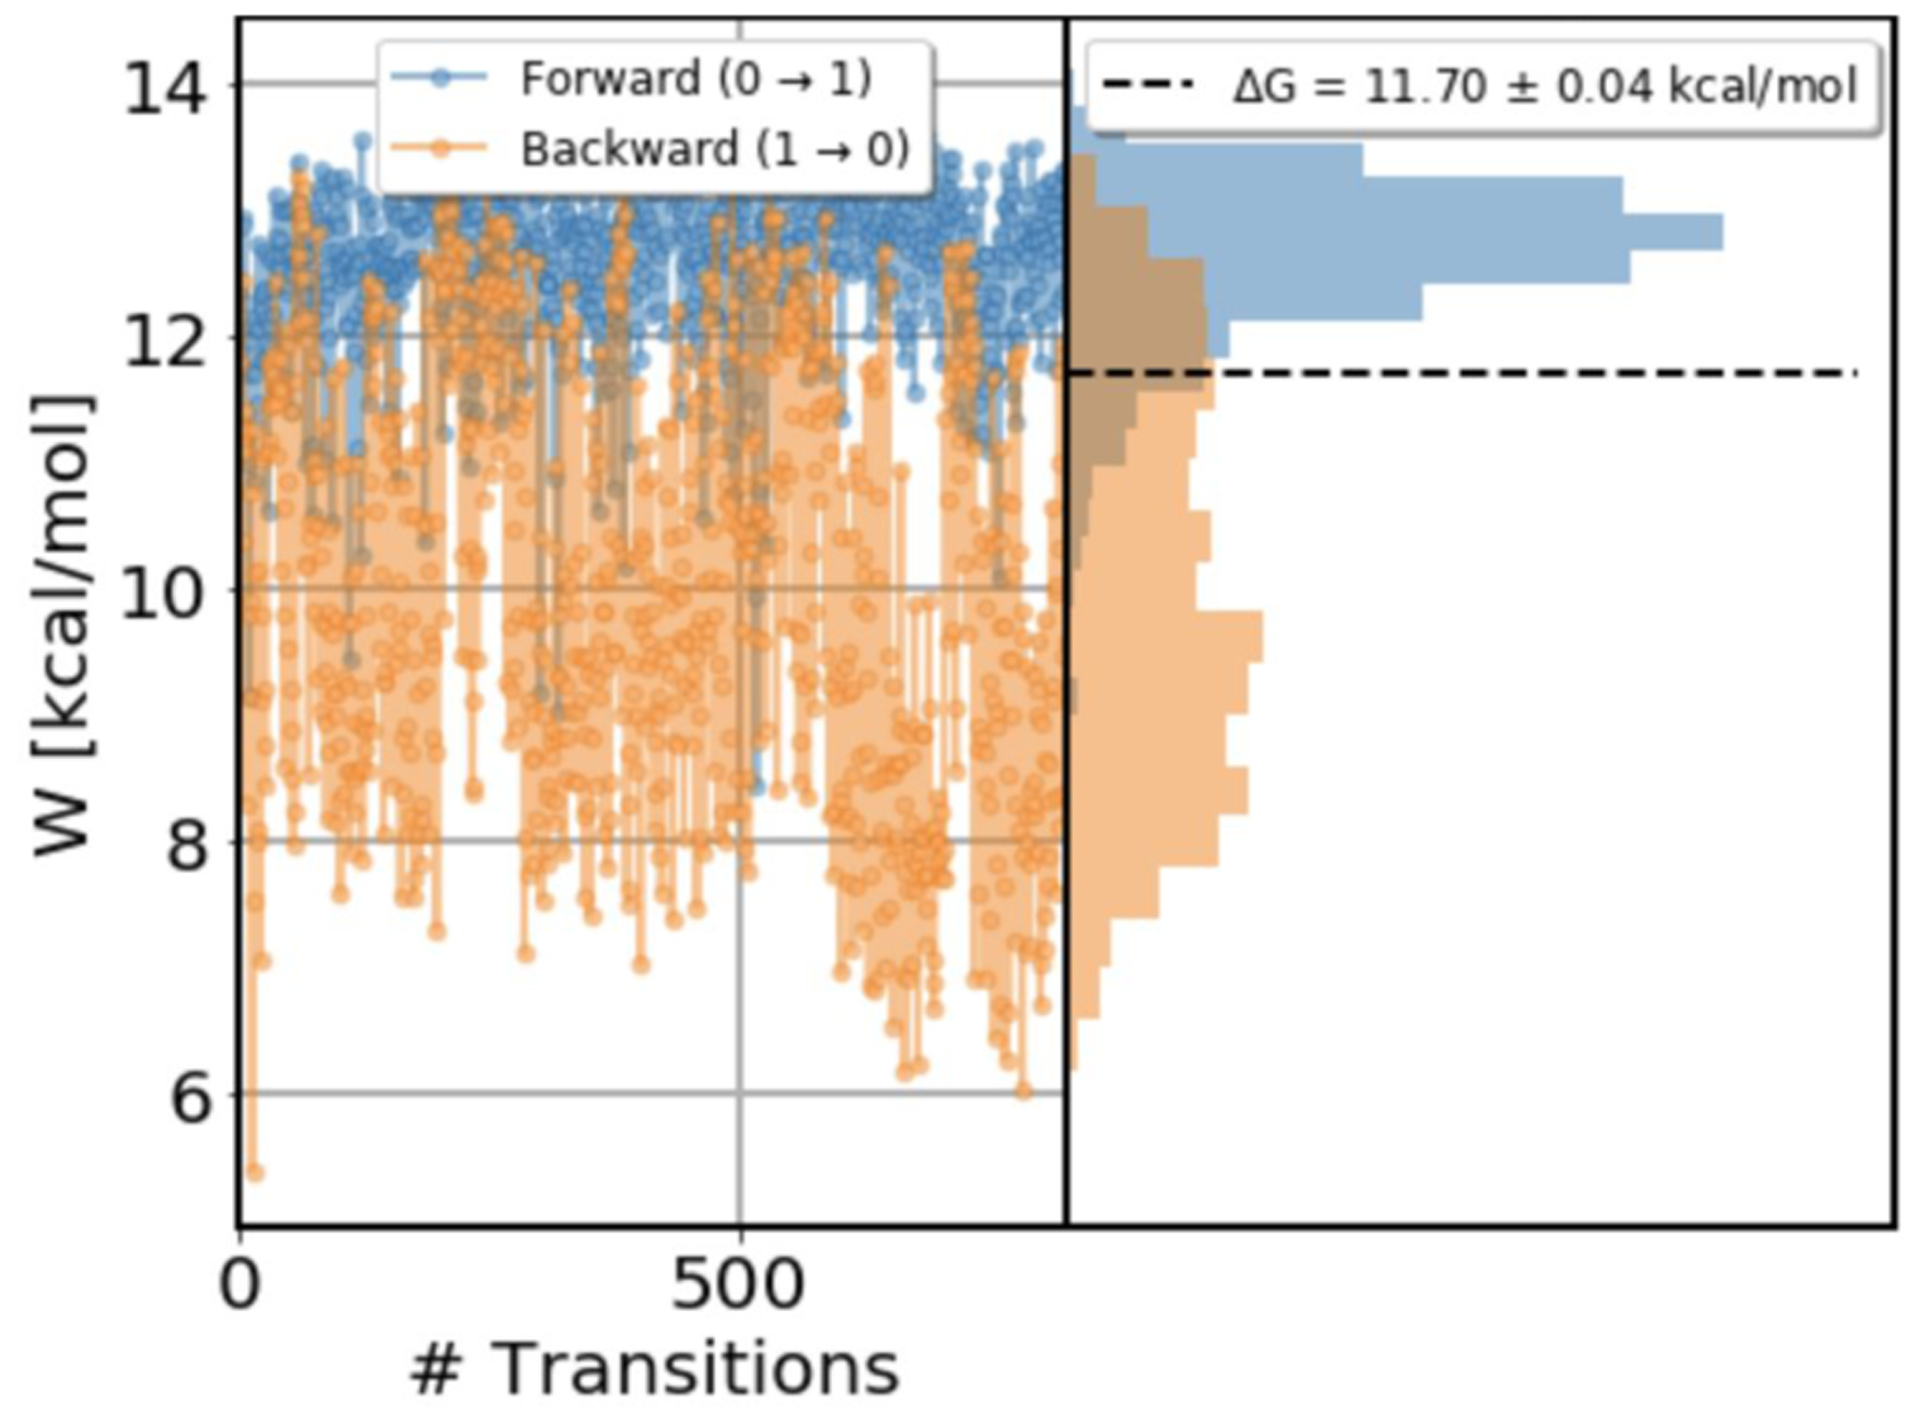
Figure 8.

Work values for toluene binding to T4 lysozyme L99A, in forward (blue) and reverse (orange) direction. Shown are values measured for each attempted transition, as well as the distribution of the work values. The transition length for each transition was 200 ps. Data from trials in the reverse direction shows sudden changes in work values and the distribution of work values is bimodal indicating a slow degree of freedom in the system.
