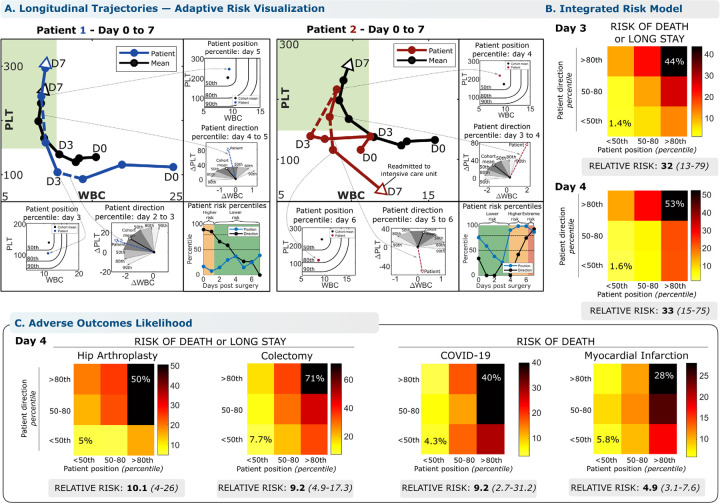
Figure 3 – The conserved WBC-PLT trajectory shape provides a generic benchmark for personalized patient risk assessment.
WBC-PLT position and direction provide an integrated trajectory-based risk model. Two patient examples are provided, one involving recovery of an initially high-risk patient (A, Patient 1), and the other involving deterioration of an initially stable patient (A, Patient 2). See main text for case details. (B) Across the entire validation cohort, the trajectory-based assessment identified patients at high risk of mortality and prolonged length of stay (LOS). Position and direction jointly contribute to risk, with patients outside the 80th percentile for both position and direction having elevated likelihood of poor outcomes. Compared to patients with good position and direction (<50th percentile), patients with poor position and direction (>80th percentile) on post-op day 4 had a 33-fold increased relative risk of adverse outcomes (CI: 13–79, 53% vs 1.6%) and stayed an average of 13 days longer in hospital. (C) For other inflammatory stimuli studied, positional and direction deviation were similarly associated with significant increases in relative risks of adverse outcomes for patients with sufficient data available: 10x for adverse outcomes following hip replacement, 9x for colectomy, 9x for mortality from COVID-19, and 5x for mortality from myocardial infarction. See Methods for more detail. Reference percentiles for position and direction and outcome likelihoods across the first 7 days post-op are given in the supplemental materials 1.13. Position and direction thresholds were calculated from the exploratory cohort, and outcome rates from the validation cohort. Position percentiles were calculated treating WBC below and PLT above the mean as non-contributing.

