
Fig. 4. Transmission bottleneck and mutation profiles between cases.
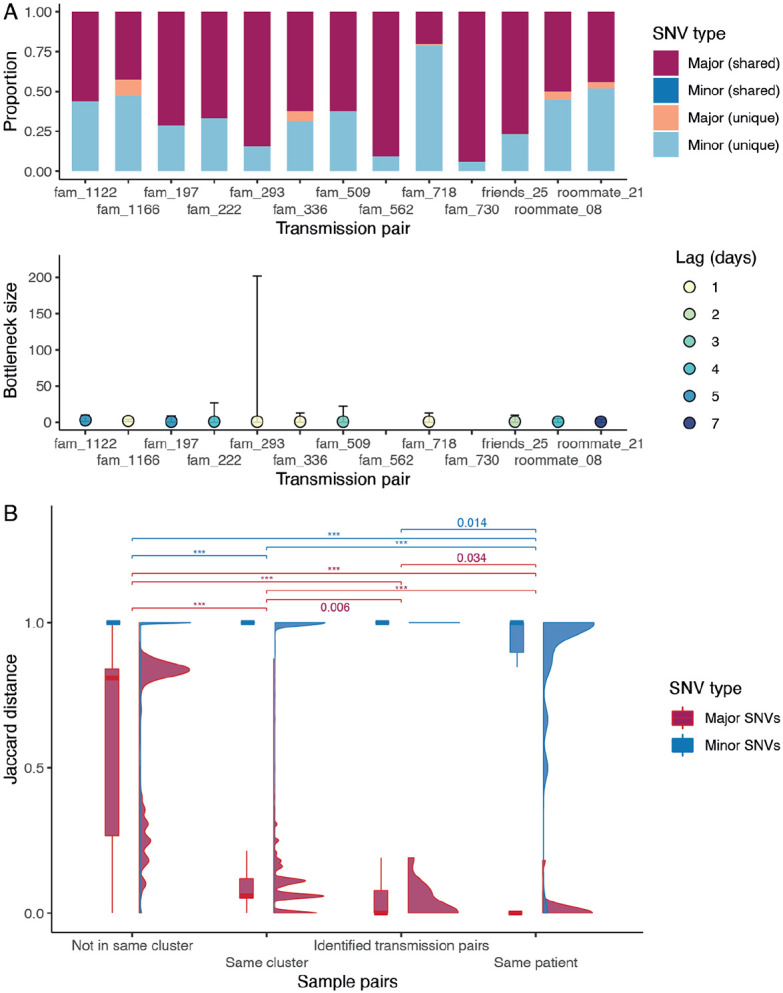
(A) Proportion of shared mutations and transmission bottleneck size estimations (with 95% confidence intervals) between samples from established transmission pairs. The estimates for transmission pairs fam_562 and fam_730 are not available due to a limited number of SNVs in the recipients’ samples. (B) Jaccard distance of the major and minor SNVs between different types of sample pairs. The distribution is shown in both boxplot and density plot. The between-group differences were tested by Wilcoxon tests, and p values < 0.05 are shown (p values < 0.001 are labelled as ***).