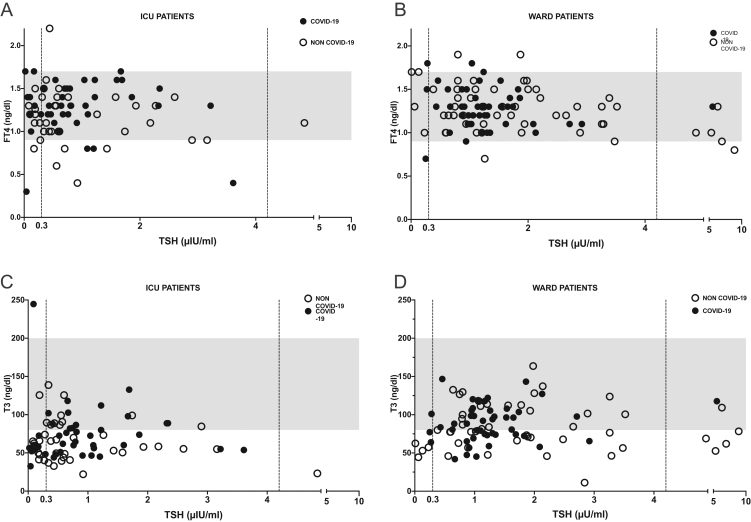
Figure 2.
Relationship between TSH and FT4 levels in ICU patients (A) and ward patients (B) and between TSH and T3 levels in ICU patients (C) and ward patients (D). COVID-19 positive patients are shown with black circles, COVID-19 negative patients with open circles. The shaded area indicates the normal range.

 This work is licensed under a